Proteins are the functional workhorses of biology. Traditional proteomics methods like mass spectrometry and flow cytometry have become a staple in many wet labs, but they often lack critical spatial context.
Recent technologies have transformed our ability to visualize protein expression and modification directly within intact tissue. What was once an abstract proteome map now becomes a richly detailed tissue blueprint revealing protein-protein interactions, signaling networks, and cellular neighborhoods.
This article is the third installment in a series investigating different “branches” of spatial technology. In part 1 and part 2 of the series, we focused on the history and commercialization of sequencing-based and imaging-based spatial RNA technologies.
In this post, we turn our attention to spatial proteomics: How do we see proteins in their native tissue context?
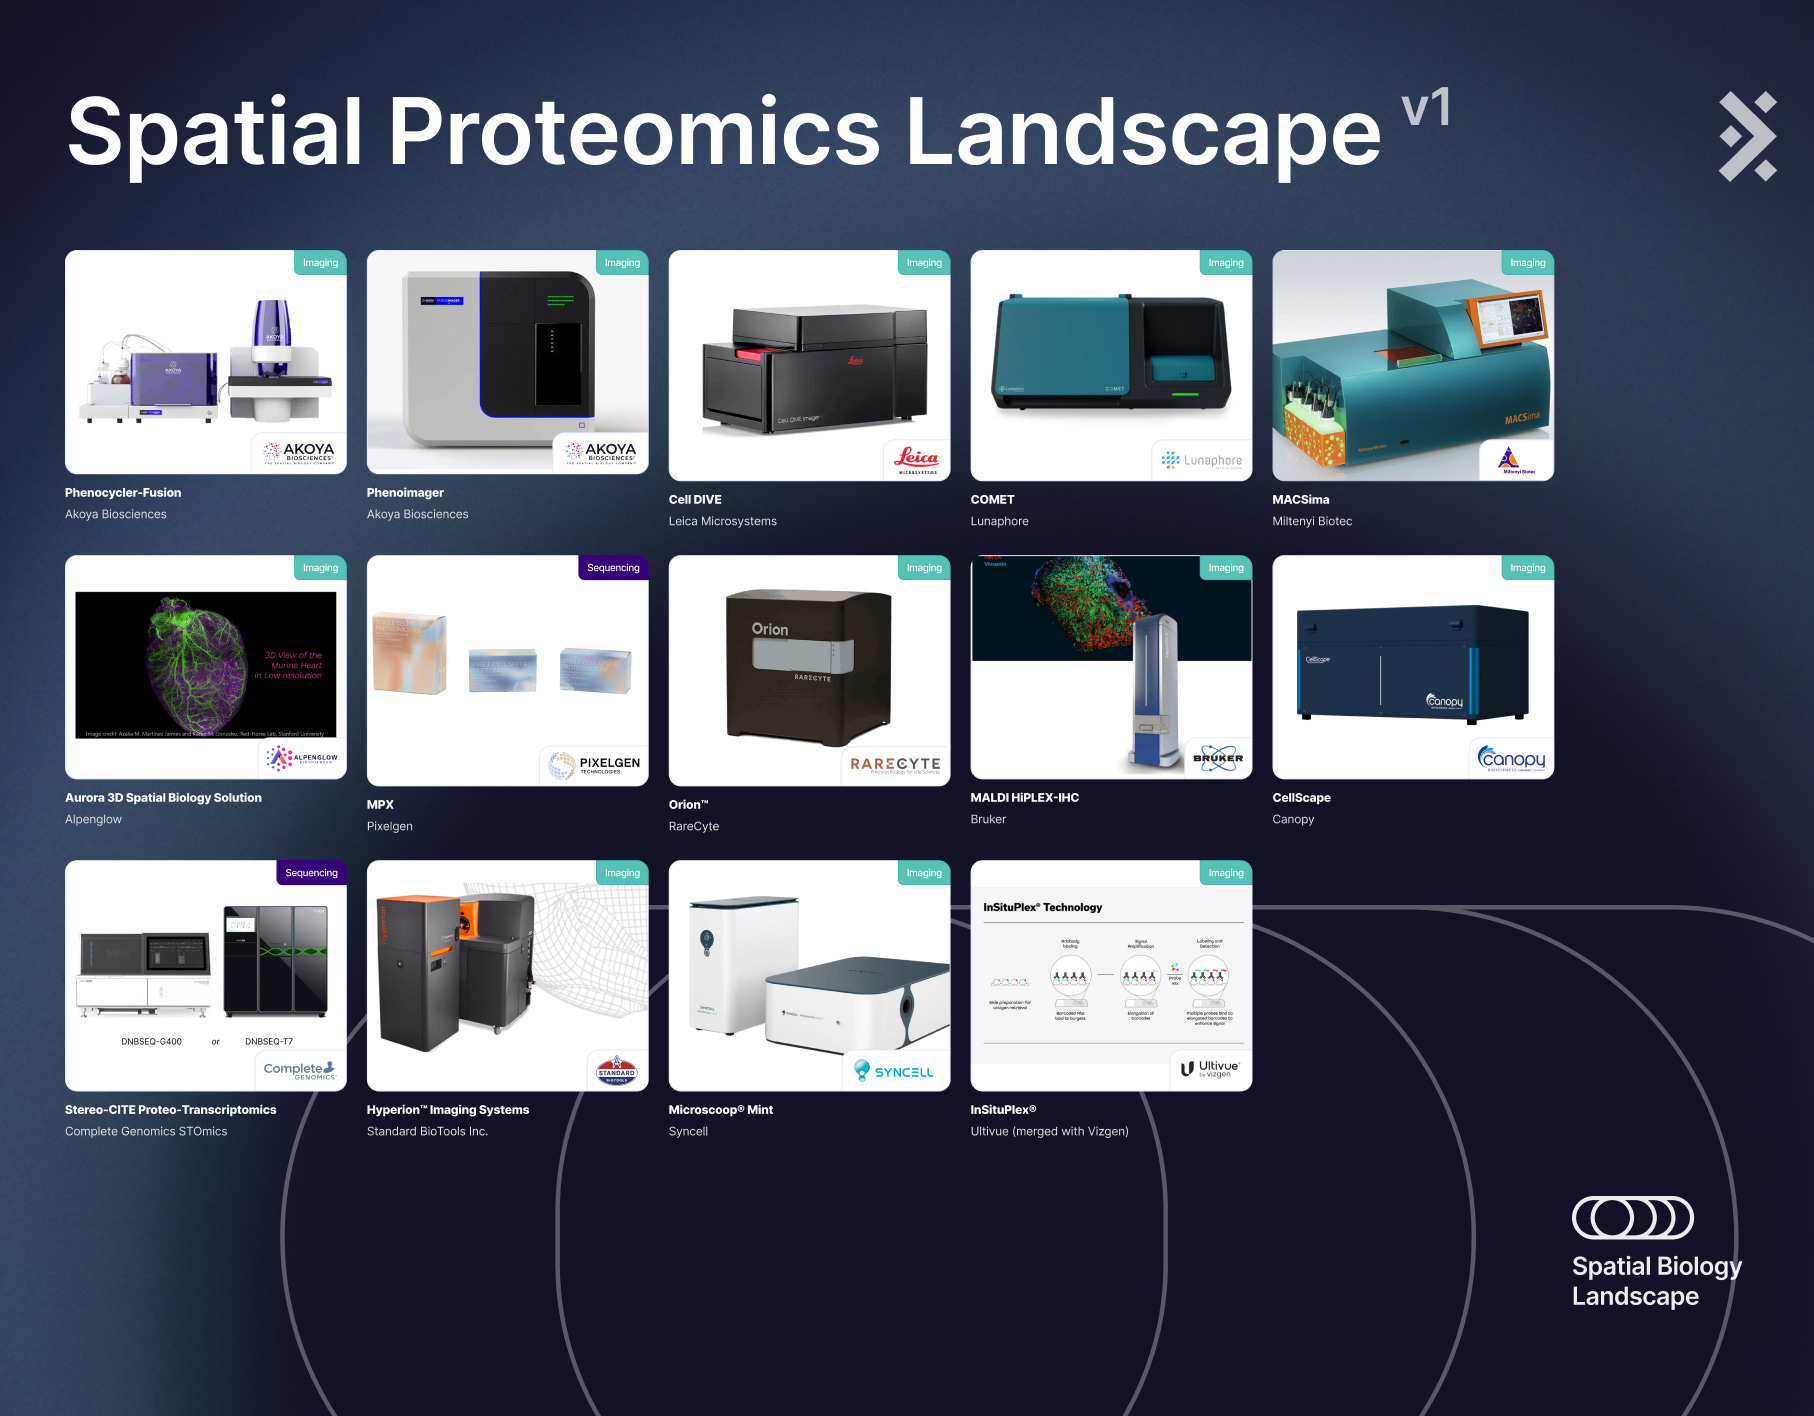
To help readers navigate the spatial landscape as a whole, we’ve extended our website spatialbiologylandscape.com of sequencing and imaging transcriptomics technologies to include the 14 proteomics products describe here.
This article will be organized by core concepts, methods by history and methods by attributes.
Please see this table of content to see the overall structure of the article and quickly jump to the part you’re interested in:
-
-
Fluorescence Imaging-based Methods
-
-
t-CycIF (Tissue-based Cyclic Immunofluorescence) (First published in 2013, refined in 2018)
-
SWITCH (System-Wide control of Interaction Time and kinetics of CHemicals) – Introduced in 2015
-
4i (Iterative Indirect Immunofluorescence Imaging) – Published in 2018
-
IBEX (Iterative Bleaching Extends Multiplexity) – Introduced in 2022
-
-
Technology Tree
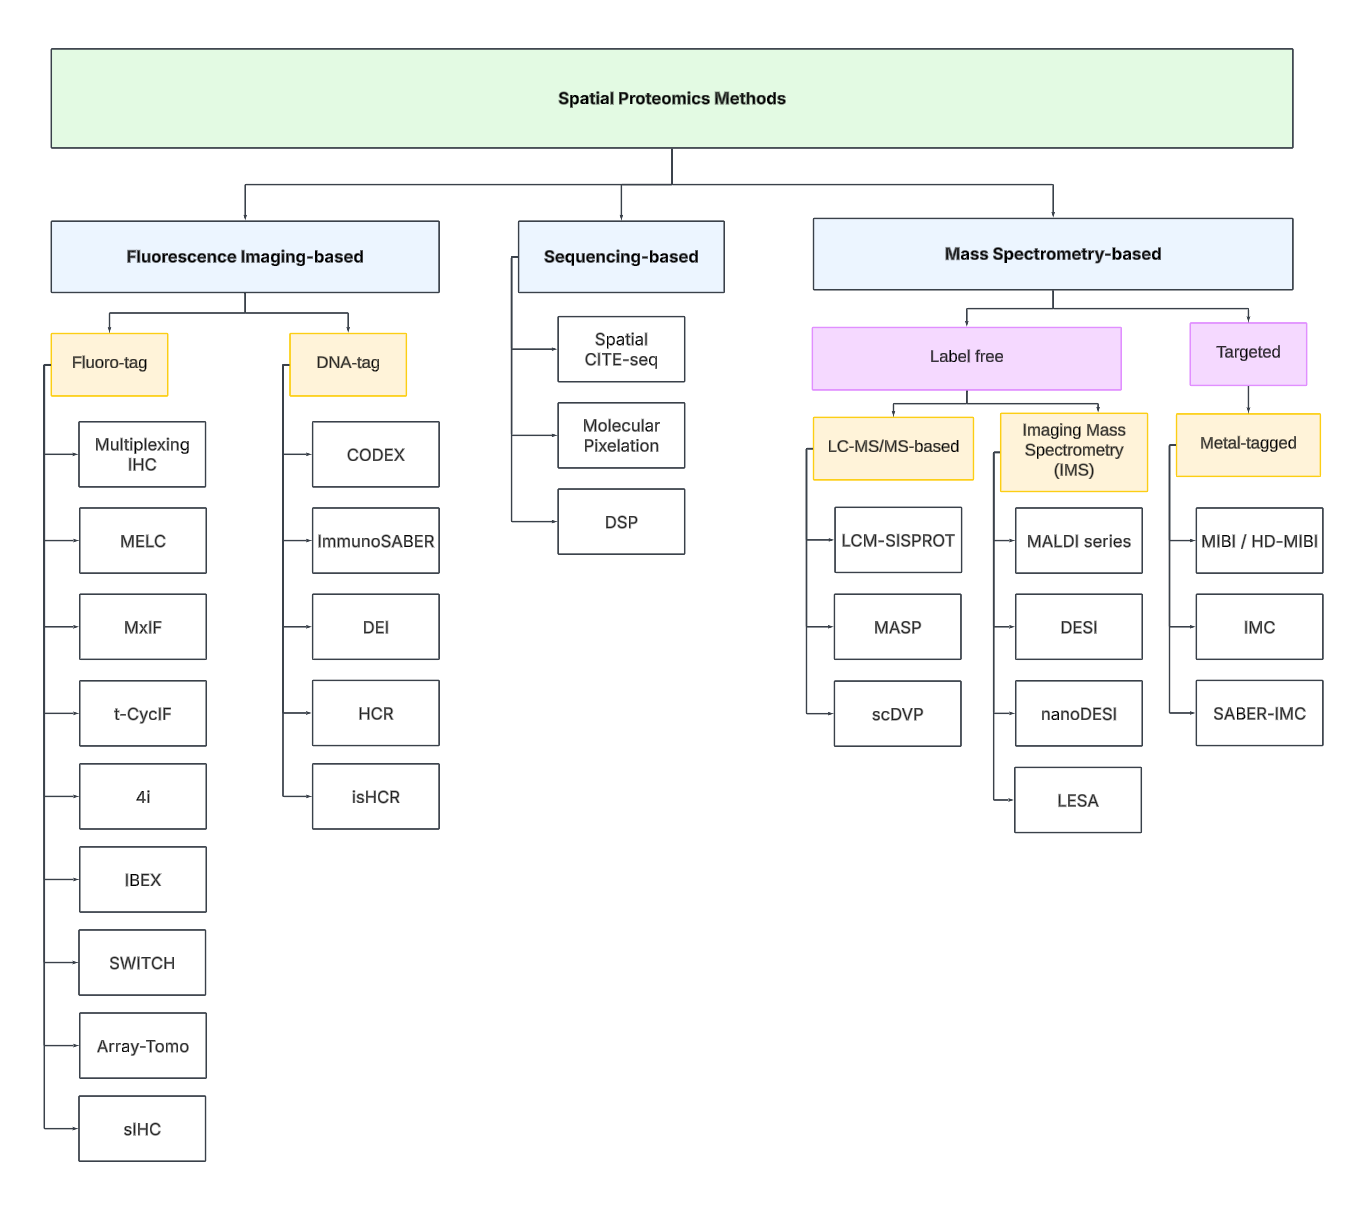
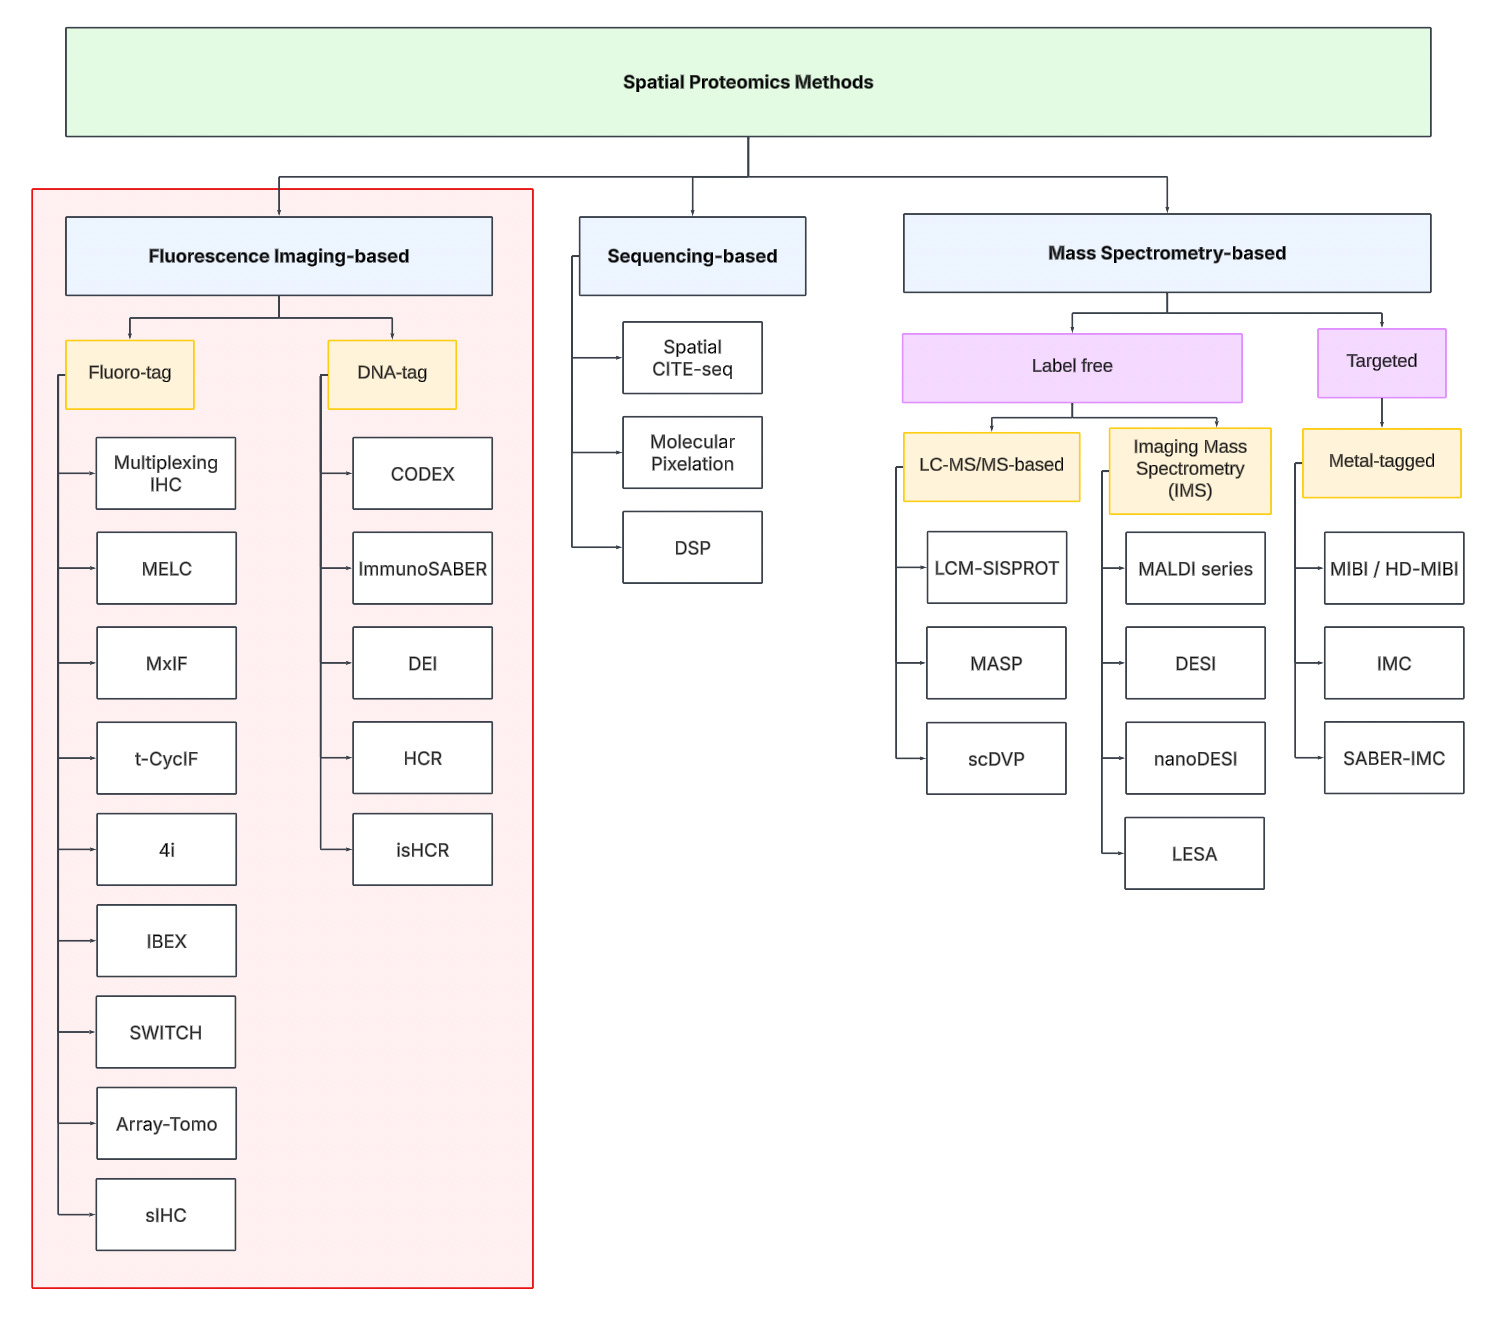
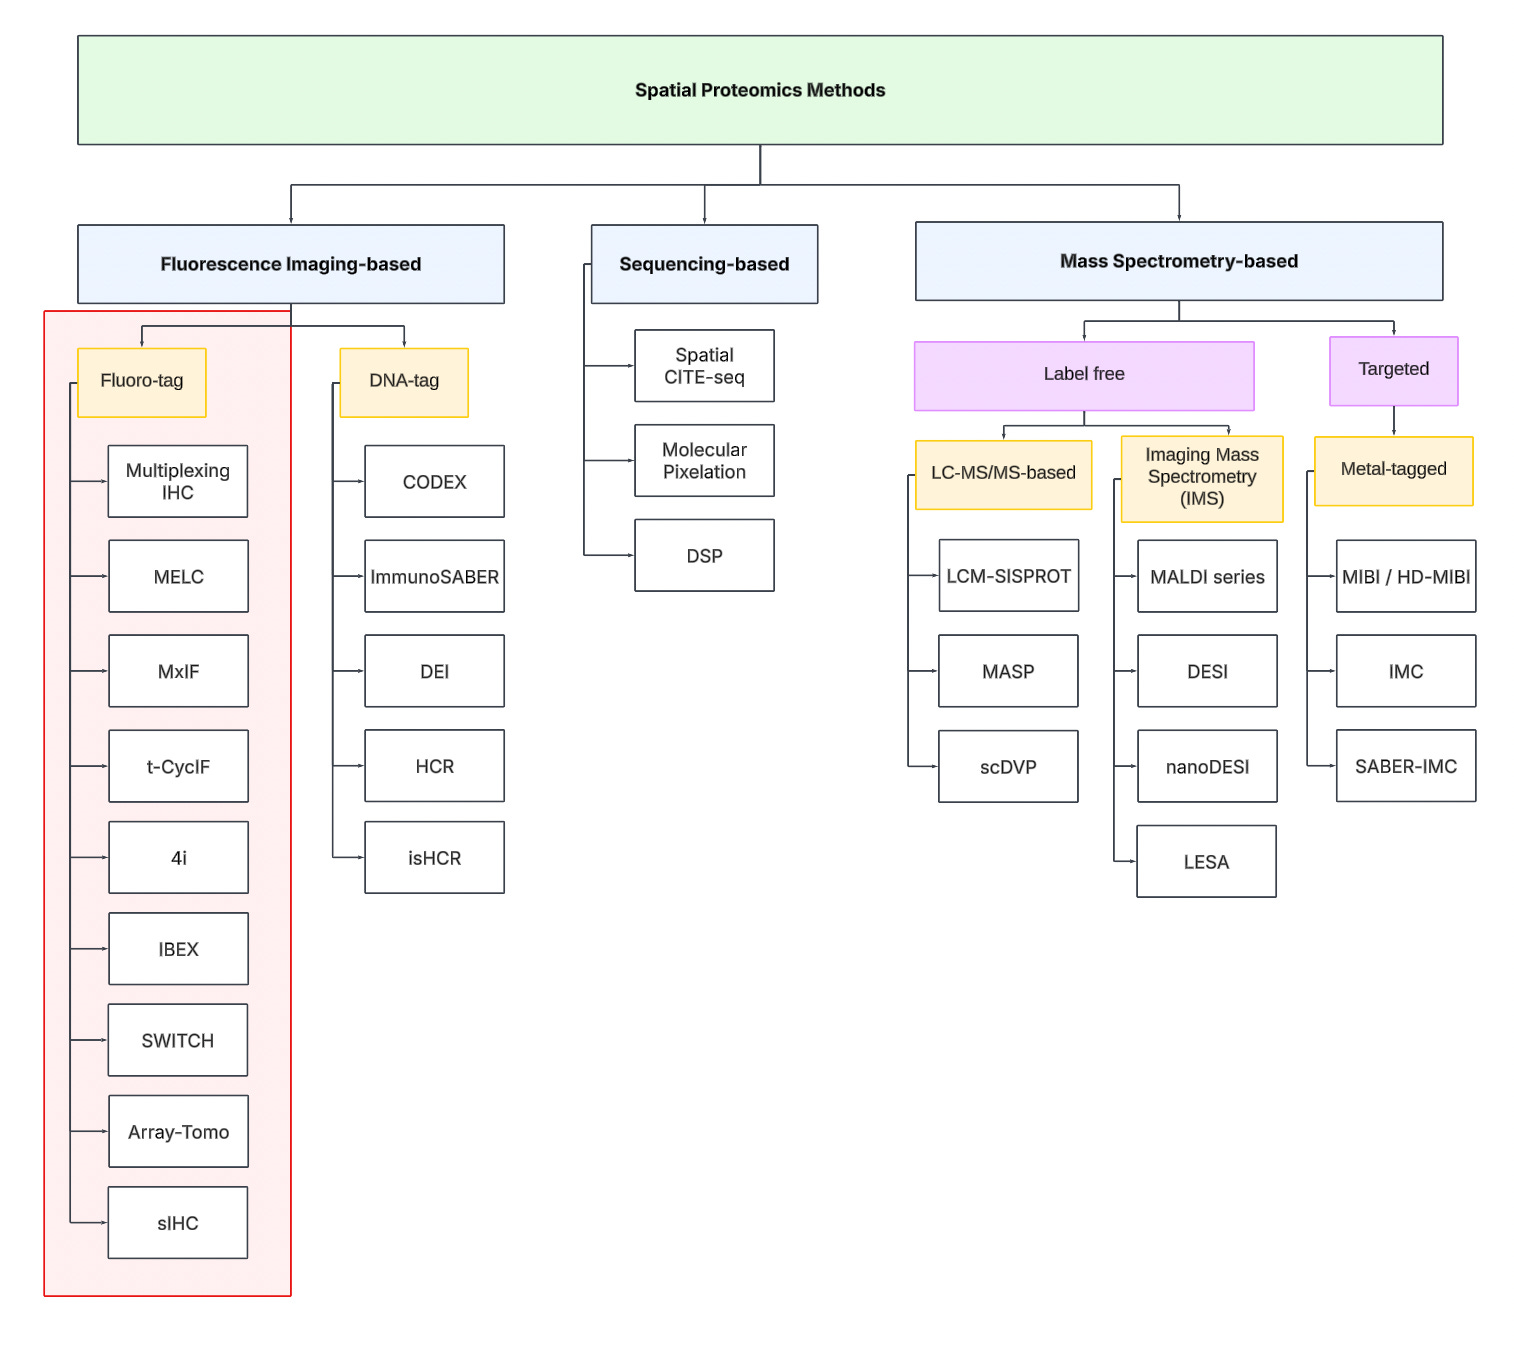
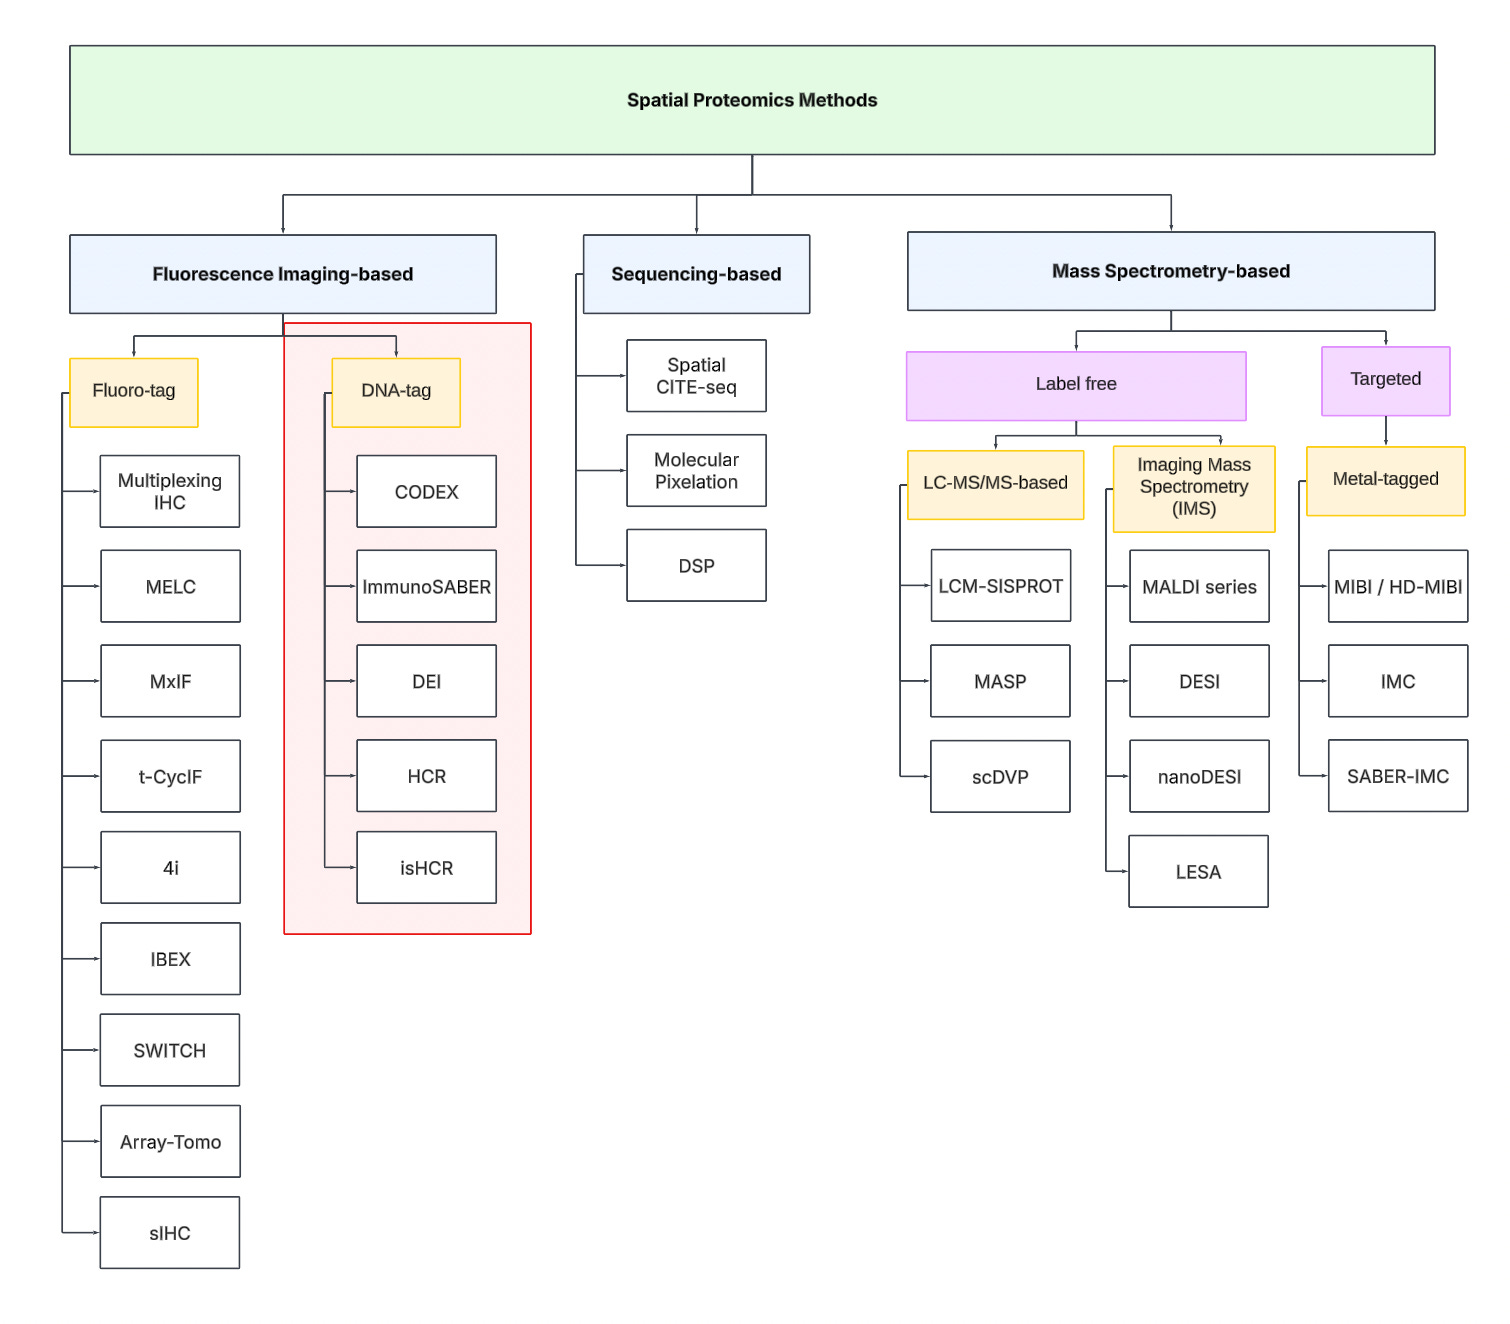
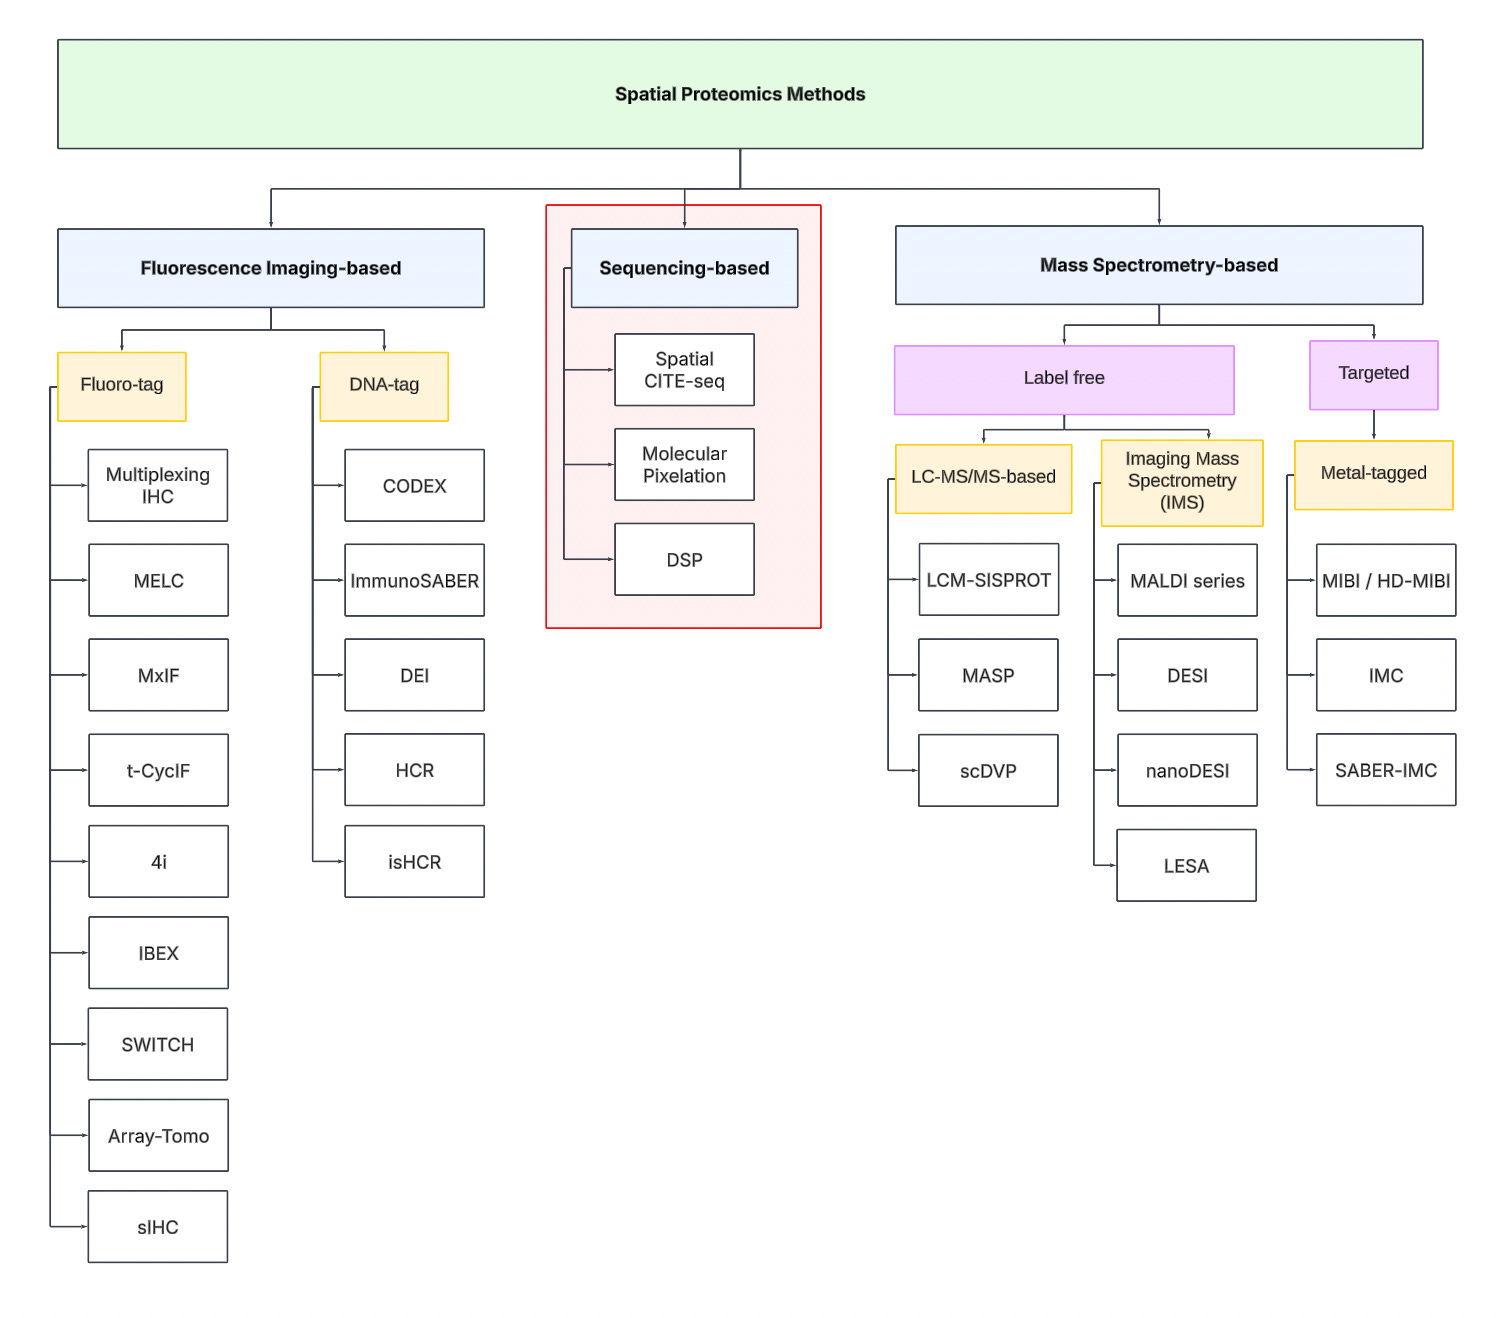
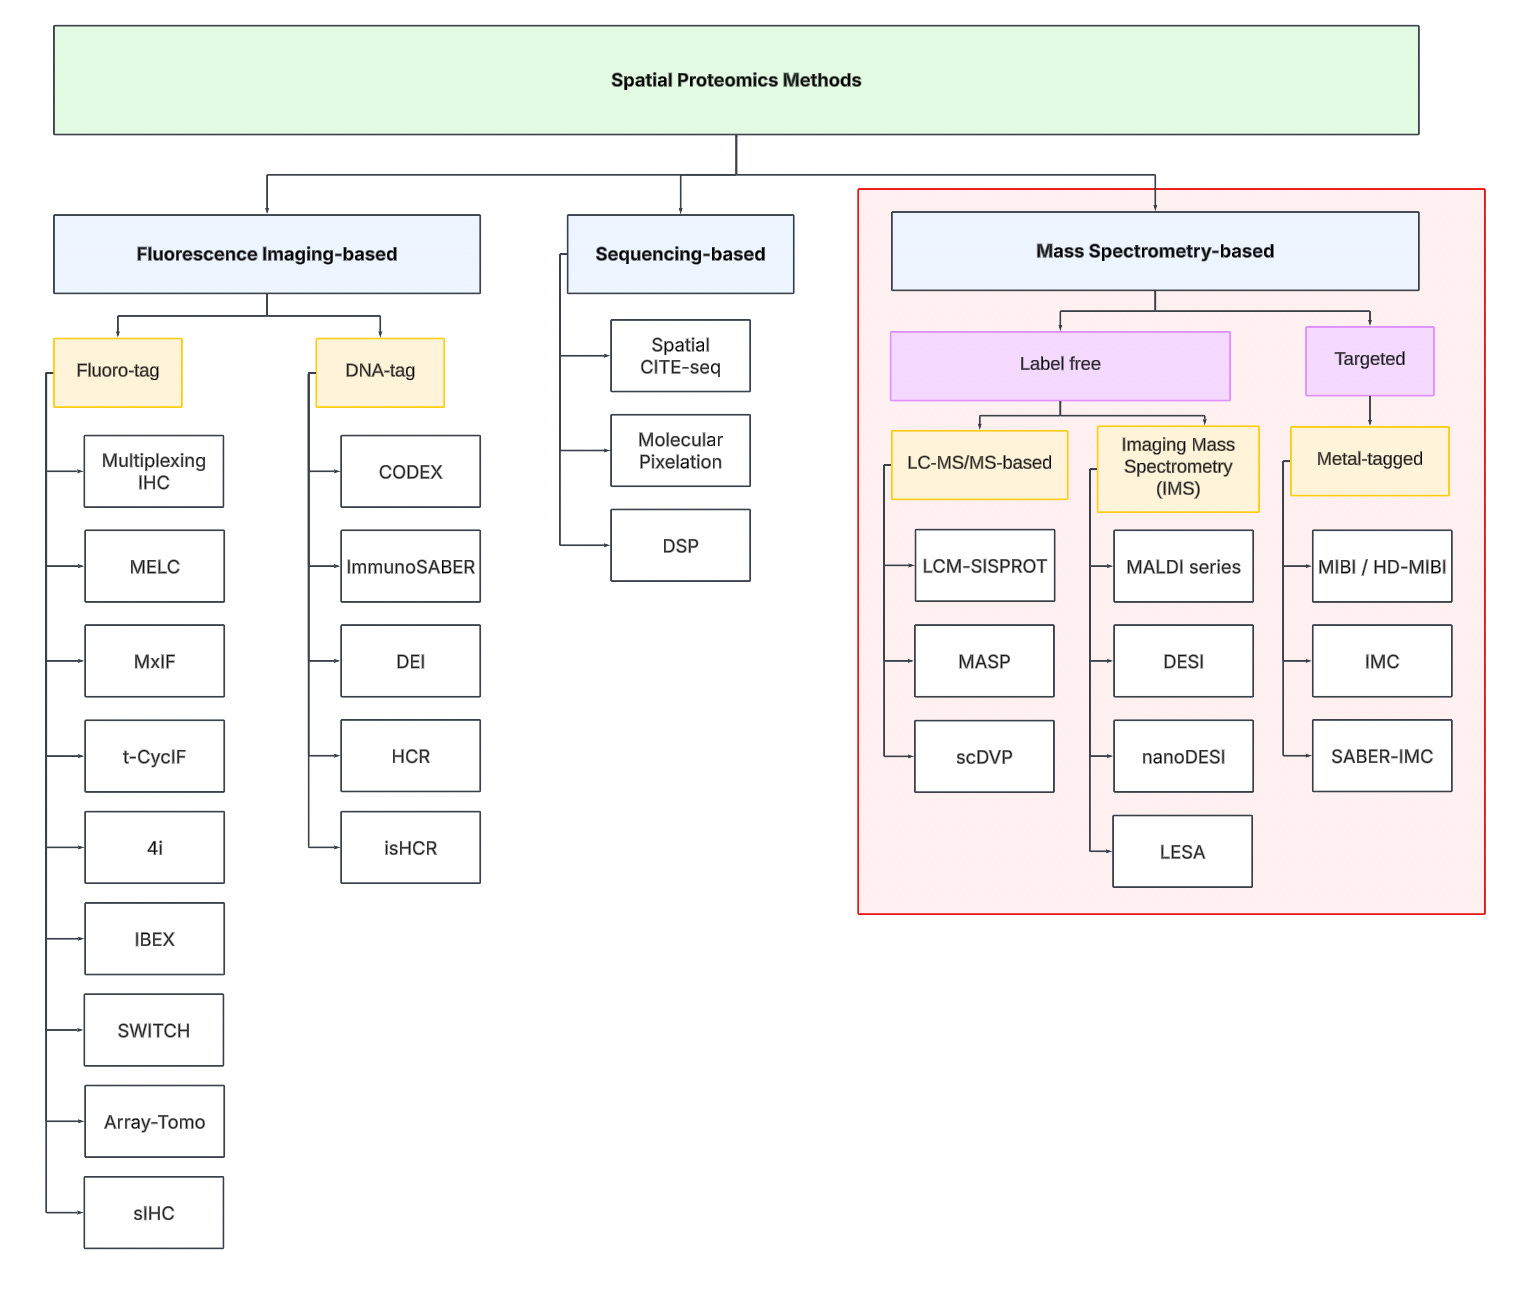
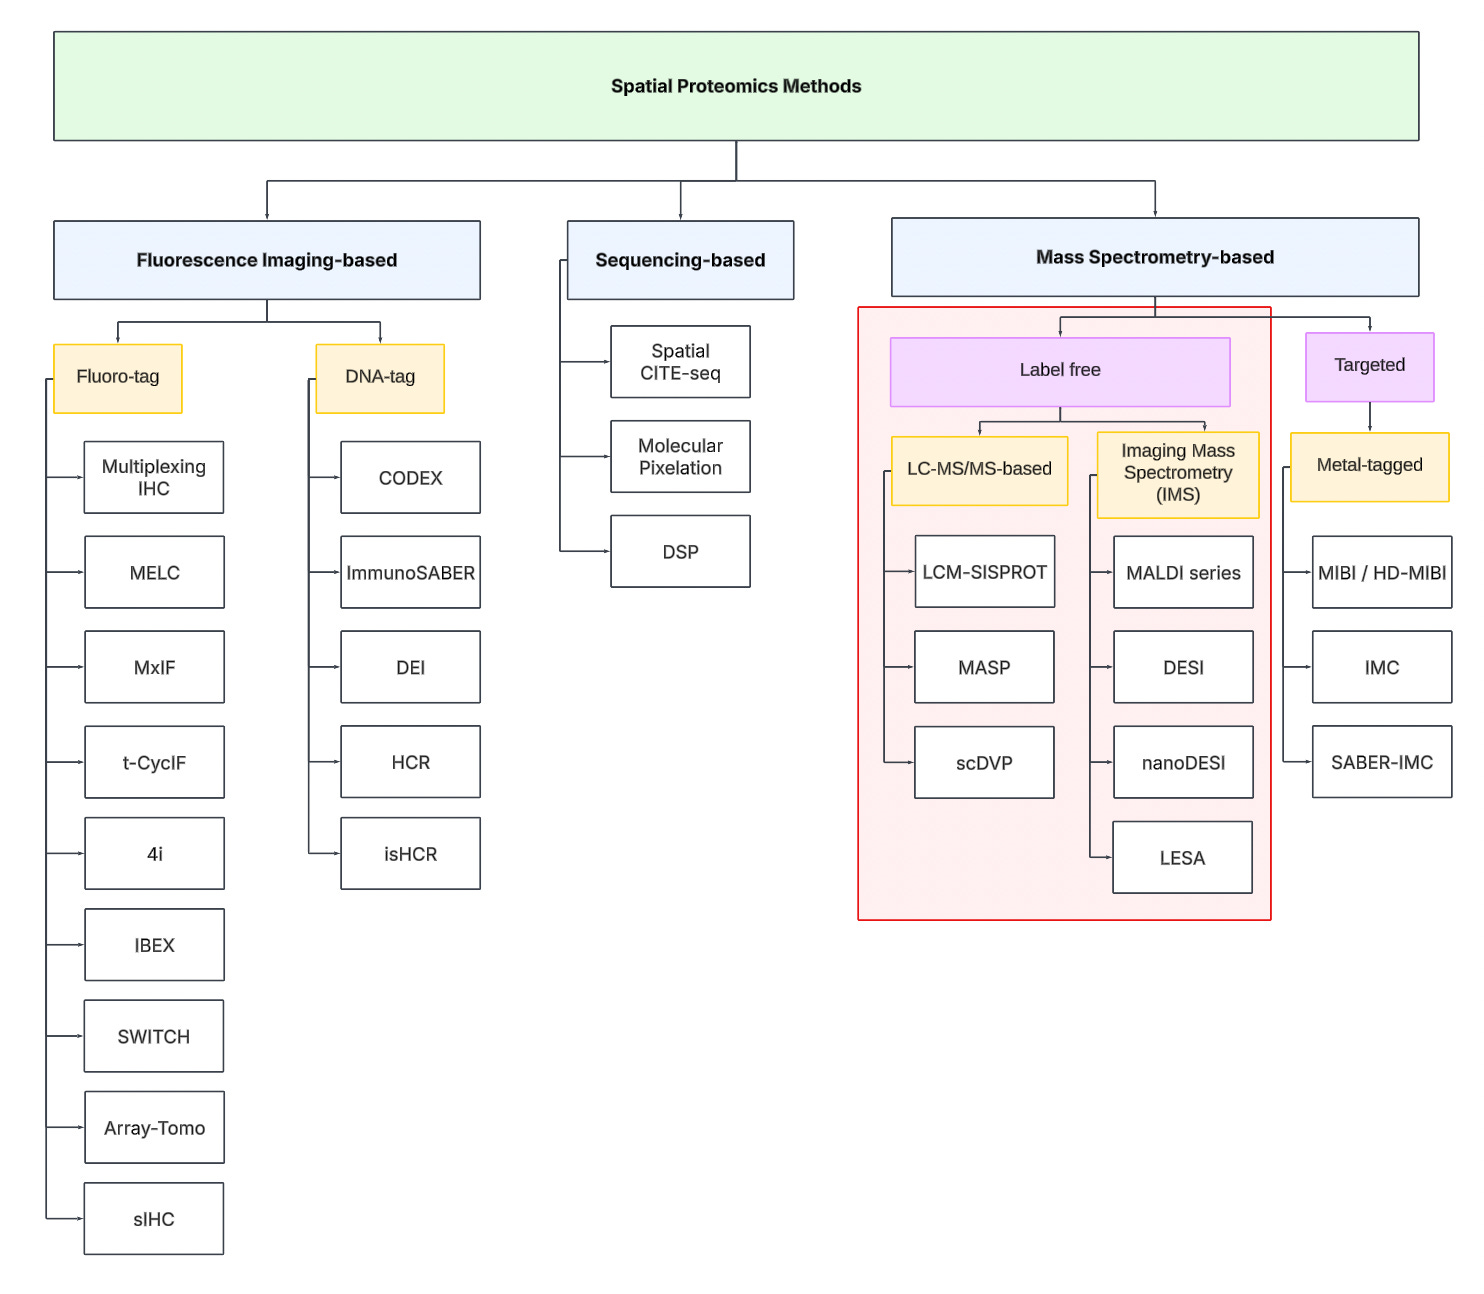
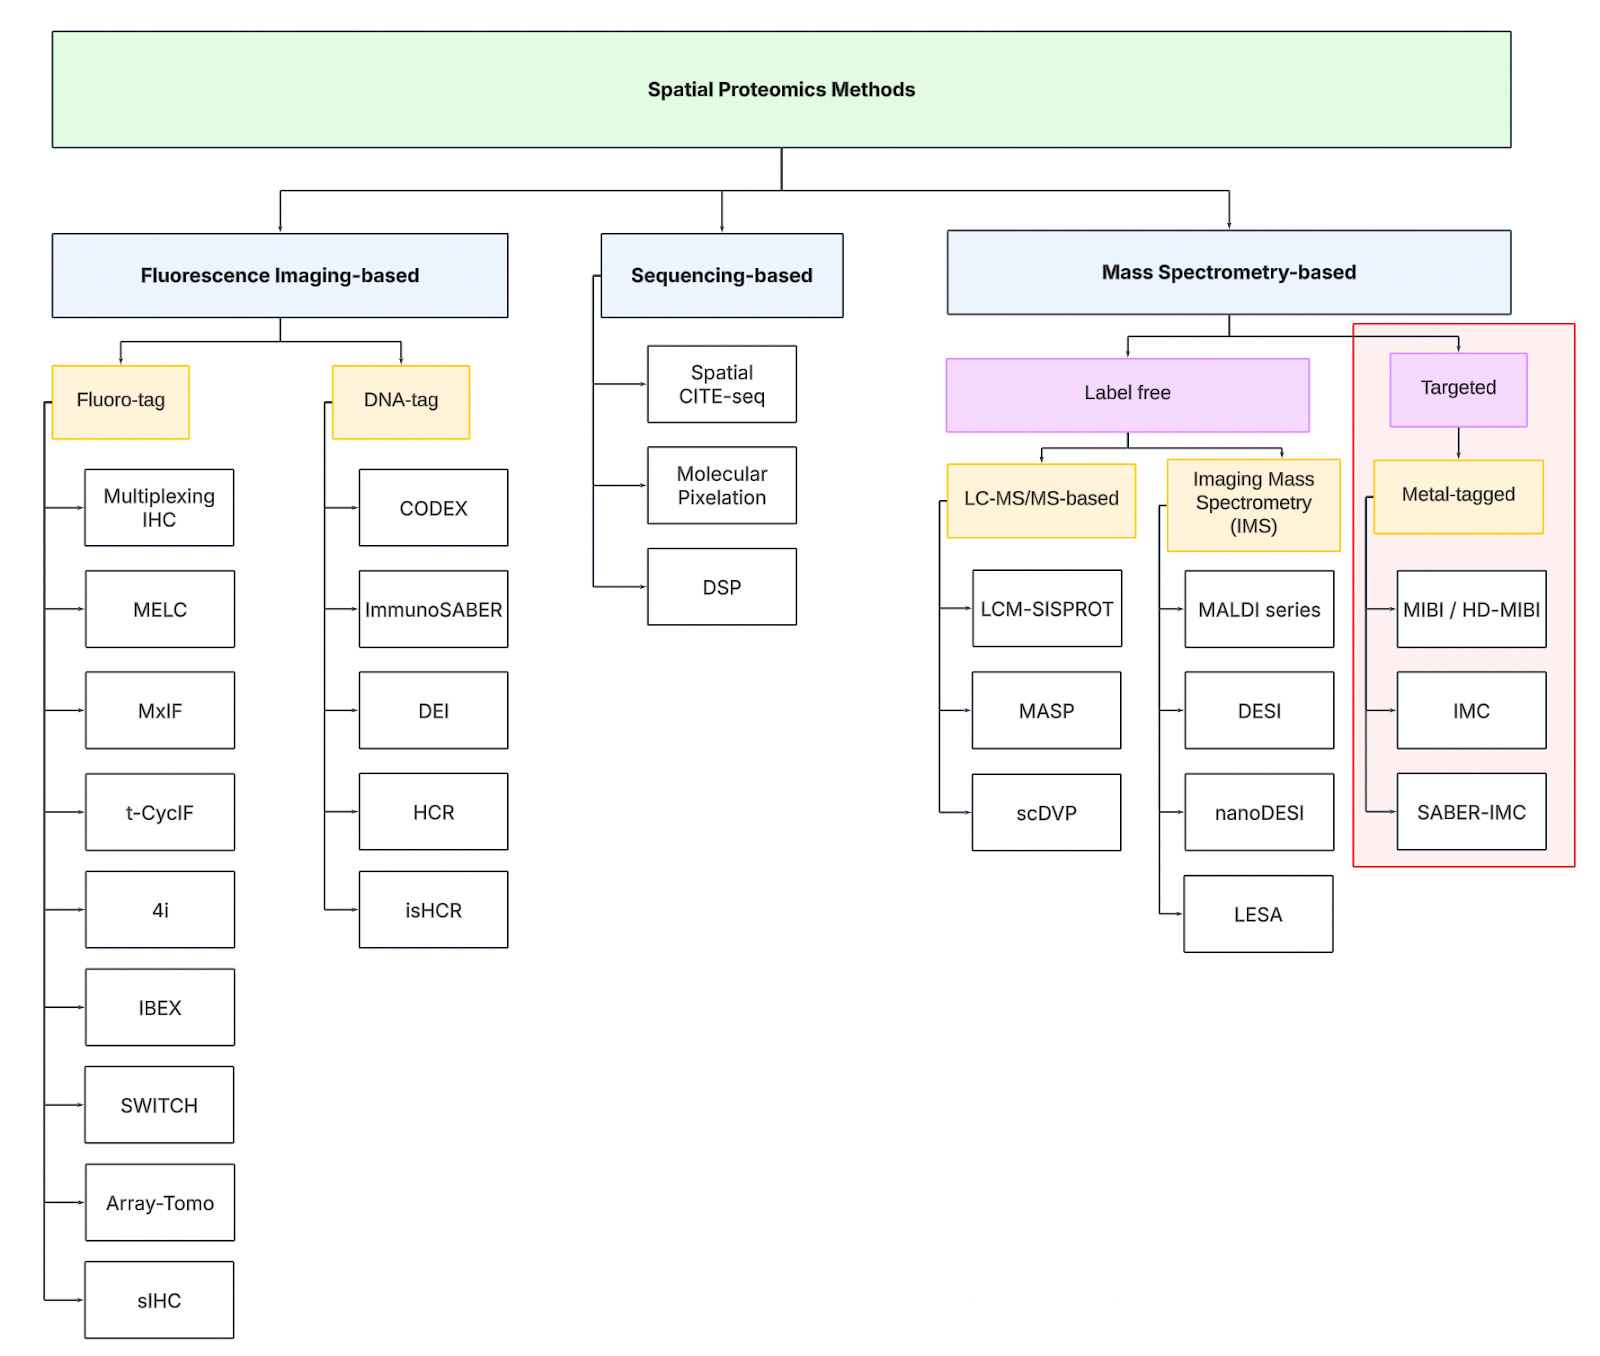
To navigate the spatial proteomics landscape, we divide it into three main categories:
-
Fluorescence Imaging-based
-
Sequencing-based
-
Mass spectrometry-based.
Fluorescence Imaging-based Methods
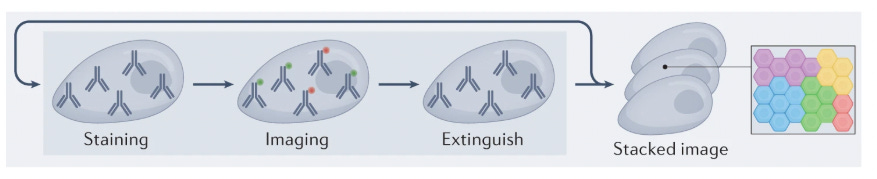
These approaches rely on protein detection via antibody labeling coupled with fluorescent microscopy. Traditional imaging techniques are limited to detecting only 5-7 proteins simultaneously due to the spectral overlap constraints of conventional fluorophores. To overcome this limitation, multiplexing strategies have emerged, following a cyclical workflow: tissue samples are stained with antibody-fluorophore conjugates, imaged to capture fluorescent signals, then subjected to antibody removal or fluorophore deactivation before repeating the process through multiple rounds to expand protein detection capacity.
Sequencing-based Methods
Sequencing-based methods involve the use of next-generation sequencing machines to quantify proteins. Unlike imaging-based methods requiring multiple staining cycles, sequencing-based techniques typically require only a single tissue staining step using specialized antibodies. Each antibody carries a unique DNA barcode that corresponds to its target protein. These DNA sequences can be amplified in situ and subsequently read out via NGS platforms.
Mass spectrometry-based Methods
Mass spectrometry (MS) approaches to spatial proteomics operate on a fundamental principle: Proteins can be identified and quantified by measuring their mass-to-charge ratios.
-
The process typically begins with a tissue section that undergoes controlled protein extraction or direct ionization from specific locations.
-
The extracted proteins are converted to gas-phase ions, which are then separated based on their mass-to-charge ratios using electric or magnetic fields. The pattern of separated ions creates a “molecular fingerprint” that can be matched to known protein signatures.
By systematically analyzing multiple positions across the tissue, researchers can construct detailed maps showing which proteins appear where, revealing crucial information about cellular organization and function without requiring antibody labeling. This approach offers particular advantages for discovery-based research, as it can detect proteins without prior knowledge of which ones might be present in the sample.
History and Key Technologies
Now that we understand how each category of method works at a high level, we will dive into the history and the evolution of key technologies under each branch.
1. Fluorescence Imaging-based Methods
1.a. Fluorophore Tags Technologies
Traditional Immunohistochemistry
Before diving into the latest advances in multiplexed protein detection, it is worthwhile to revisit the basic principles of traditional immunohistochemistry (IHC).
Immunohistochemistry (IHC) was first developed in the 1940s by Albert H. Coons and colleagues. In 1941, Coons successfully labeled antibodies with fluorescent dyes, allowing the visualization of antigens in tissue sections. This was the foundation of immunofluorescence, which later evolved into modern IHC techniques using enzyme-linked antibodies (such as peroxidase or alkaline phosphatase) for chromogenic detection in the 1960s and 1970s.
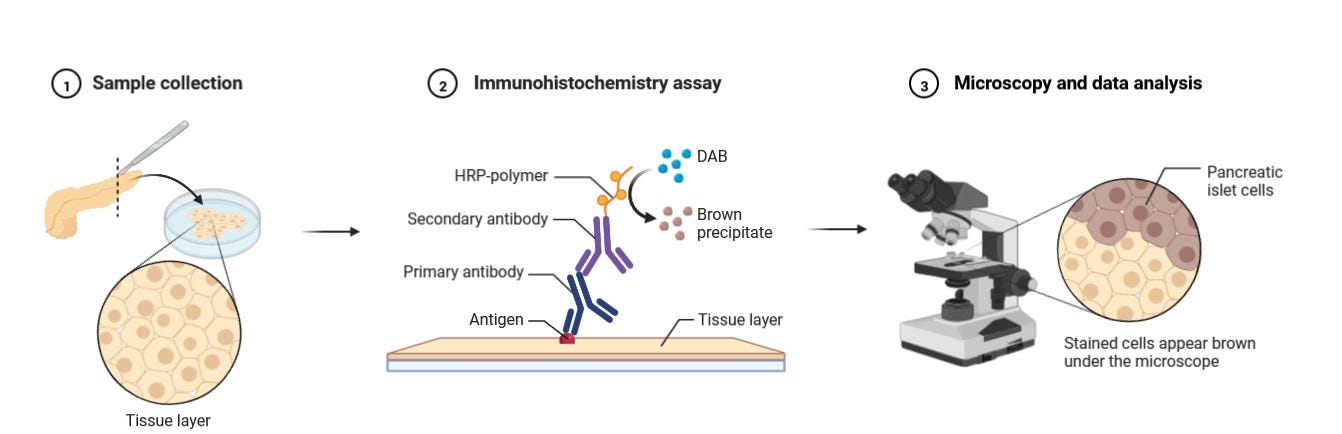
Immunohistochemistry (IHC) follows these key principles:
First, a fixed tissue sample is exposed to antibodies that target specific antigens. This typically involves a primary antibody that binds to the target, followed by a secondary antibody carrying either a fluorescent tag (visible under fluorescence microscopy) or an enzyme. With enzyme-labeled antibodies, adding the appropriate substrate creates a colored deposit exactly where antibody binding occurred.
For some applications, directly labeled primary antibodies can be used, skipping the secondary antibody step, though this often results in weaker signals.
Multiplexing IHC
Despite its utility, traditional IHC faces several technical hurdles:
-
Spectral overlap between fluorophores, limiting the number of detectable targets
-
Cross-reactivity of antibodies, leading to non-specific staining
-
Limited multiplexing capacity, restricting simultaneous detection of multiple markers
-
Tissue autofluorescence, reducing signal clarity in fluorescence-based IHC
These problems mean only 3-5 proteins can be detected in an IHC experiment.
To solve this, the concept of multiplexing IHC emerged: Instead of staining for just one or two markers at a time, this method uses multiple cycles of staining, imaging, and washing. In each cycle, specific antibodies bind to their target proteins and are visualized using fluorescent or chromogenic labels. After imaging, the markers are removed, and the process is repeated with new antibodies. By layering these cycles, researchers can build a detailed picture of how different proteins are distributed and interact within the tissue.
Over the past decades, many strategies for multiplexed IHC have been developed, such as MELC, MxIF, t-CycIF, sIHC, SWITCH, Array-Tomo, 4i, and IBEX. We will walk through the key concepts of how each works below.
MELC (Multi-Epitope Ligand Cartography) (2006)
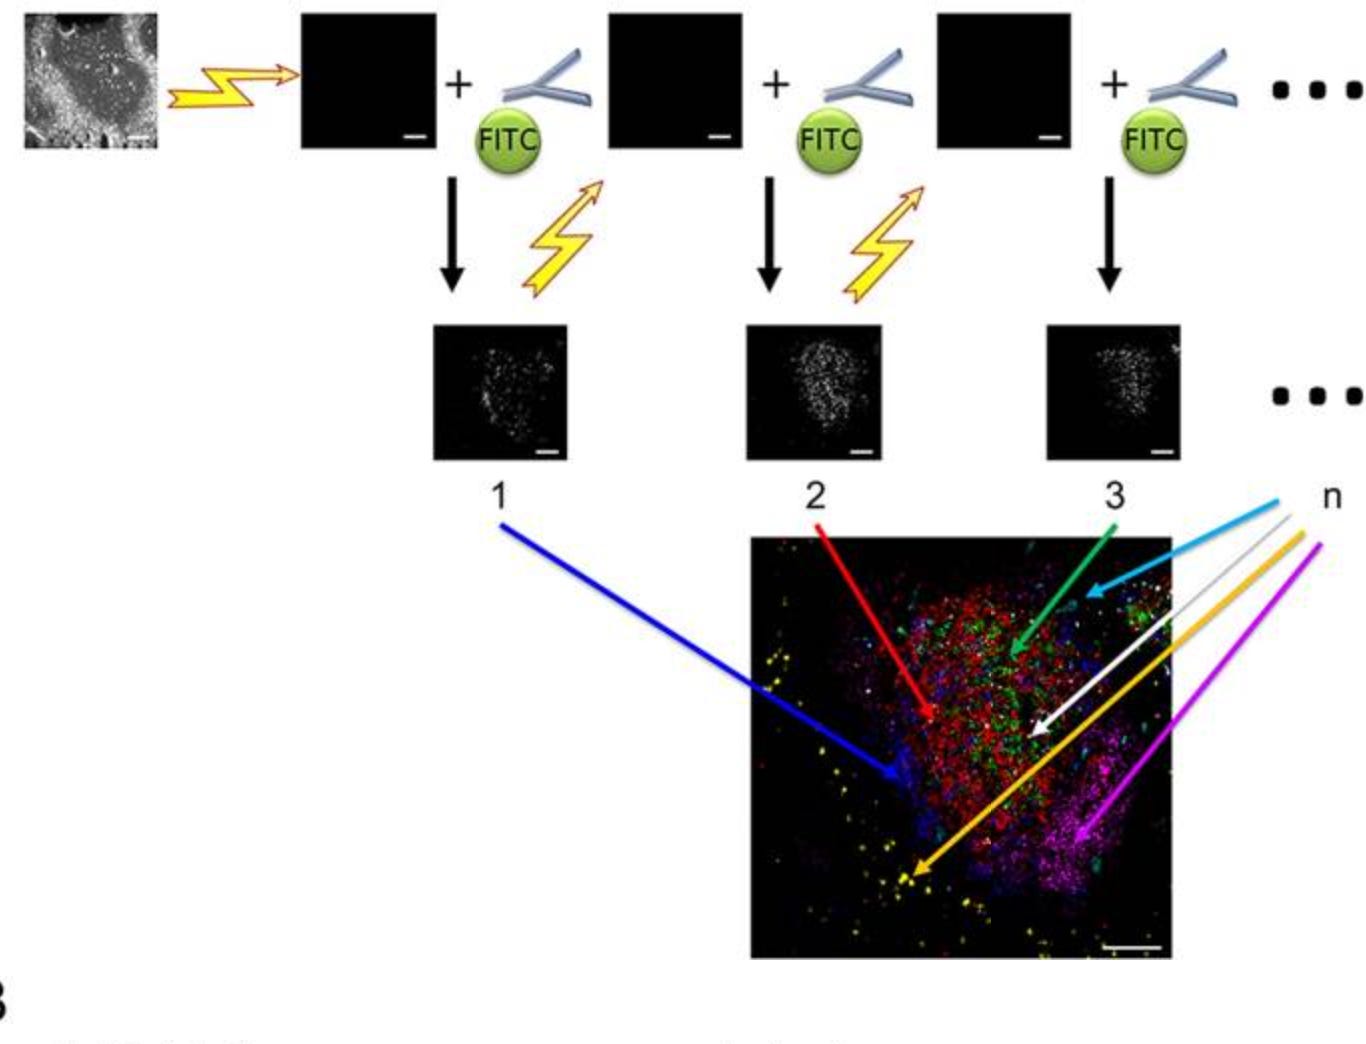
One of the first examples of multiplexed IHC is Multi-epitope ligand cartography (MELC), a fully automated robotic platform that enables highly standardized iterative immunofluorescence imaging.
The process begins with a fixed tissue sample where a fluorophore-labeled antibody is applied, imaged at precise coordinates, then completely photobleached to eliminate signal before the next antibody cycle. This automation enables detection of 100+ proteins on a single tissue section with perfect spatial registration between images.
The data processing pipeline integrates these sequential images into a multidimensional dataset where each pixel contains information about dozens of proteins present at that precise spatial location. Downstream computational analysis then identifies protein expression patterns and co-localization networks that reveal functional cellular neighborhoods.
Despite its powerful capabilities, MELC does face several limitations. The sequential staining process is time-consuming, often requiring multiple days for high-plex imaging. Photobleaching, while gentler than chemical inactivation, can still cause cumulative tissue damage over many cycles, potentially affecting antibody binding in later rounds. There is also the challenge of antibody validation across many targets, as cross-reactivity becomes increasingly problematic with higher target numbers. The extensive automation, while reducing human error, requires specialized equipment not widely available in standard laboratories.
MxIF (Multiplexed Immunofluorescence) (2013)
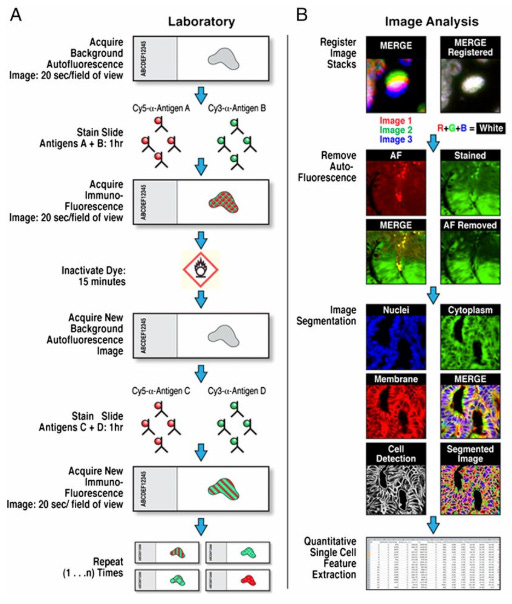
Unlike MELC, which uses photobleaching for signal removal, MxIF uses alkaline oxidation chemistry for fluorophore inactivation and requires background autofluorescence imaging before each staining round. Although MxIF’s chemical approach for fluorophore quenching offers more complete signal elimination, it may also cause greater cumulative tissue damage compared to MELC’s light-based photobleaching.
After imaging, the fluorescent dye is inactivated, creating a clean slate for the next antibody set. This approach has demonstrated the capability of analyzing up to 61 different proteins in single tissue samples and has been successfully applied to reveal heterogeneity in ductal carcinoma breast cancer samples.
t-CycIF (Tissue-based Cyclic Immunofluorescence) (First published in 2013, refined in 2018)
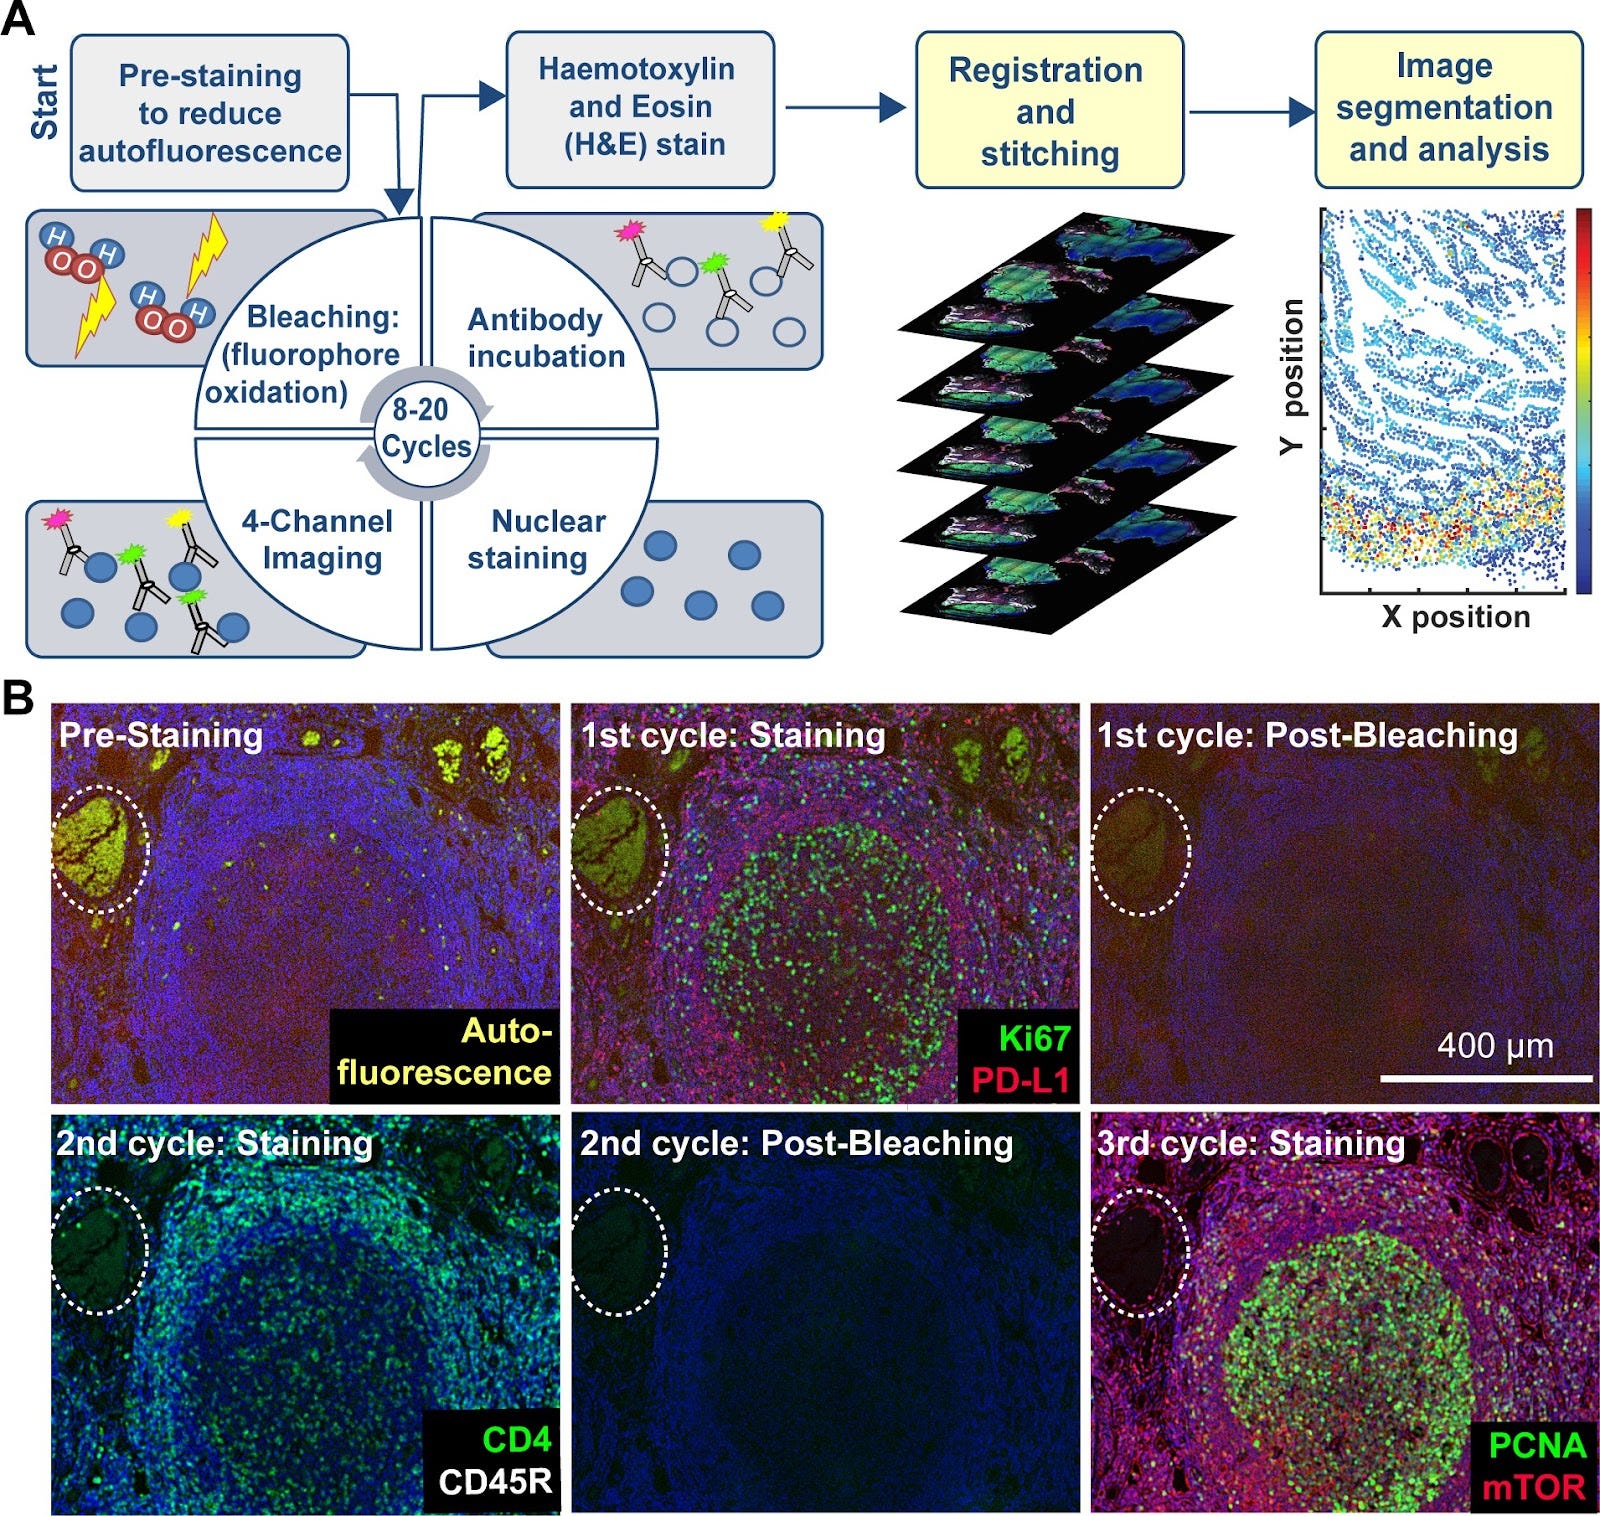
t-CycIF represents a major shift toward accessibility and scalability in multiplexed IHC. Unlike MELC and MxIF, which rely on specialized automation and proprietary chemistry, t-CycIF uses standard reagents, commercially available antibodies, and open-source software, making it significantly more cost-effective and widely applicable.
The process follows a cyclic workflow similar to MELC and MxIF: staining with fluorophore-conjugated antibodies and imaging, followed by fluorophore inactivation by oxidation (with hydrogen peroxide), alkaline pH, and light, and a final wash step. Subsequent rounds of staining, imaging, and removal are then performed. This is usually done with four-channel imaging, where 3 channels are used for different antibody-conjugated fluorophores, and the 4th channel is used for a counterstain, such as Hoechst.
Unlike MELC and MxIF, which focus on fixed tissues, CycIF can also be applied to live-cell studies and has been used to study the immune microenvironment of brain tumors and SARS-CoV-2 viral infection in macaque lungs. An extension of CycIF was published in 2018 that is applicable to FFPE tissues, called t-CycIF. The use of standard reagents and commercially available antibodies make CycIF more accessible and applicable to a wide variety of contexts.
sIHC (Sequential Immunohistochemistry)
Sequential Immunohistochemistry (sIHC) is a multiplexed protein detection technique that extends traditional IHC workflows by using iterative cycles of antibody staining, detection, imaging, and antibody removal. Unlike fluorescence-based cyclic methods such as MELC or t-CycIF, which rely on fluorophore bleaching or chemical inactivation, sIHC preserves tissue integrity by using gentle antibody elution buffers between cycles. This allows for the progressive accumulation of protein expression data while ensuring that tissue architecture remains intact. Notable atlases constructed based on principles of sIHC include Cancer Tissue Atlas developed by Gerdes et al. (2013), The Human Protein Atlas, or head and neck squamous cell carcinoma atlas by Tsujikawa et al. (2017).
One of sIHC’s key advantages is its clinical applicability. Because it uses standard FFPE (formalin-fixed paraffin-embedded) samples and widely available reagents, it can be easily integrated into diagnostic workflows without requiring specialized equipment. This has made sIHC particularly valuable in cancer pathology, where analyzing the spatial relationships between tumor cells, immune infiltrates, and stromal components can provide critical insights for treatment decisions. By bridging the gap between research and routine diagnostics, sIHC has helped bring multiplexed protein imaging into real-world clinical practice.
SWITCH (System-Wide control of Interaction Time and kinetics of CHemicals) – Introduced in 2015
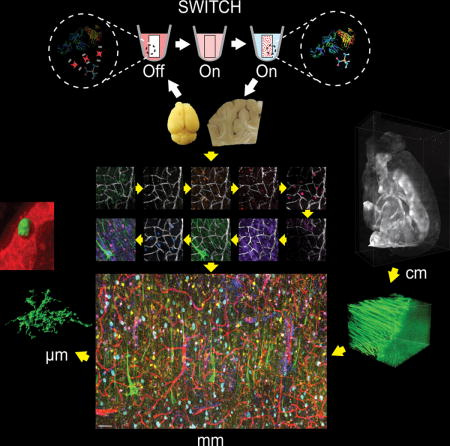
While previous techniques enable multiplexed protein detection in thin tissue sections, it is inherently limited by antibody penetration depth—a challenge when working with thicker samples or whole organs. SWITCH, introduced in 2015, overcomes this limitation by introducing precise temporal control over molecular interactions, allowing for uniform immunolabeling of intact three-dimensional tissues.
SWITCH operates through a unique ON/OFF buffer system that can dynamically regulate antibody-tissue interactions:
-
OFF state: A global chemical environment prevents unwanted antibody binding, allowing for sample preparation and clearing without premature staining.
-
ON state: The system is switched to allow controlled antibody binding, ensuring deep and even penetration across thick tissue volumes.
This method enables whole-organ immunolabeling with subcellular resolution, a breakthrough for spatial proteomics and large-scale tissue mapping. Unlike traditional immunostaining methods that suffer from uneven labeling—especially in deeper tissue regions—SWITCH allows researchers to achieve uniform staining across entire tissue structures while preserving endogenous molecules and tissue architecture.
In the original publication by Murray et al. (2015) in Cell, researchers demonstrated SWITCH’s capabilities by imaging more than a dozen proteins across intact mouse brains, revealing brain-wide cellular networks and their molecular characteristics. Since then, the technique has been applied to mapping neural circuits, tracking disease-related protein aggregates throughout brain volumes, and analyzing the three-dimensional organization of diverse tissue types.
Array-Tomo – Introduced in 2018
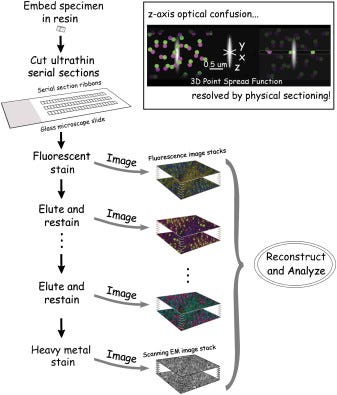
Another approach for 3D protein imaging is Array Tomography (ArrayTomo), which combines physical sectioning with iterative immunofluorescence. The method begins with embedding tissue in resin and cutting it into ultrathin sections (50-200 nm), which are then mounted as ordered arrays on glass slides. These ultrathin sections overcome the axial resolution limitations of conventional light microscopy and reduce the problem of antibody penetration encountered in thicker tissue preparations. Each section undergoes multiple rounds of antibody staining, imaging, and antibody elution using a mild solvent that strips antibodies while preserving tissue structure and protein epitopes.
This strategy enables reconstruction of three-dimensional protein distributions at subcellular resolution, providing insights into protein localization that would be impossible with single-plane imaging techniques. The method allows for the imaging of dozens of proteins across the same tissue volume while maintaining precise spatial registration. Additionally, the stable preservation of the tissue in resin permits indefinite storage and revisiting of samples for additional markers long after initial processing.
4i (Iterative Indirect Immunofluorescence Imaging) – Published in 2018
While sIHC and t-CycIF advanced multiplexed immunostaining by enabling sequential antibody cycling and signal removal, they still faced trade-offs between signal intensity and antibody availability. sIHC relies on chromogenic detection, limiting multiplexing capacity, while t-CycIF uses direct fluorophore-conjugated antibodies, which can sometimes yield weaker signals. Unlike earlier methods that compromise between signal strength and multiplexing capacity, 4i employs indirect immunofluorescence, where unlabeled primary antibodies bind targets before fluorophore-conjugated secondary antibodies attach, creating significant signal amplification that reveals even low-abundance proteins with exceptional clarity.
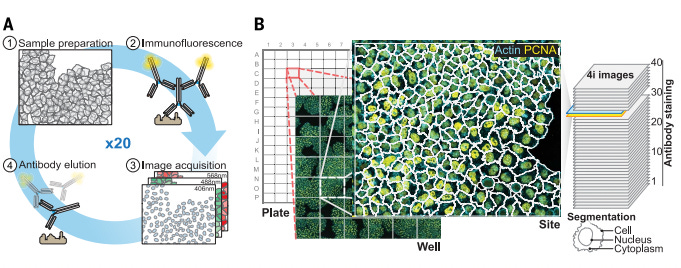
The true innovation of 4i lies in its discovery and prevention of photocrosslinking, a previously unrecognized phenomenon where fluorophore excitation generates oxygen radicals that covalently bind antibodies to tissues. By developing specialized imaging buffers containing radical scavengers and crosslinking acceptors, 4i enables complete antibody removal between cycles without harsh chemicals that degrade samples, preserving epitope integrity across at least 20 iterations.
This technological advancement allows 4i to simultaneously capture information across multiple biological scales—from population-level cell crowding effects to subcellular protein organization with nanometer precision—all in the same experiment. The method uses standard off-the-shelf antibodies without special conjugations, making it highly accessible and cost-effective for research laboratories.
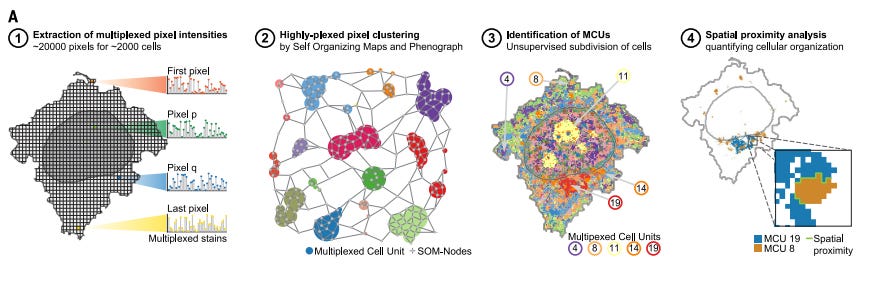
In their landmark Science publication, Gut et al. demonstrated 4i’s ability to map 40+ proteins in thousands of cells with perfect spatial registration. Their computational approach generates Multiplexed Protein Maps (MPMs) that quantify protein organization at subcellular resolution, revealing previously hidden relationships between protein localization patterns and functional cellular states. This has proven particularly valuable for understanding complex processes like signal transduction pathways, nuclear organization dynamics, and how cells respond to environmental changes or drug treatments.
IBEX (Iterative Bleaching Extends Multiplexity) – Introduced in 2022
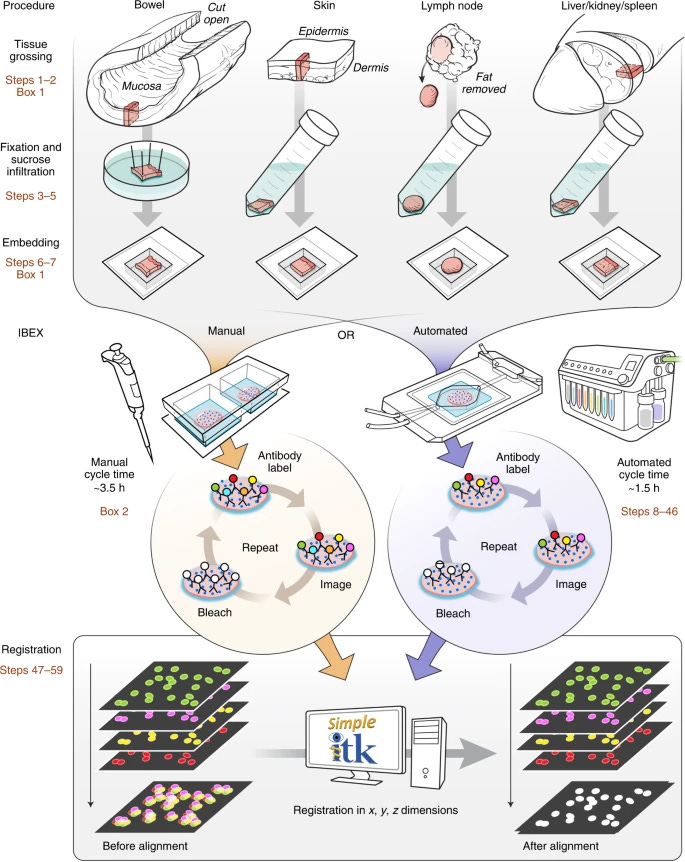
Iterative Bleaching Extends Multiplexity (IBEX) is an innovative technique for high-content imaging that enables visualization of over 65 parameters in diverse tissue types. Developed as an accessible alternative to proprietary systems, IBEX employs chemical bleaching with lithium borohydride (LiBH₄) to inactivate fluorophores between imaging cycles.
The method follows a straightforward workflow of iterative antibody labeling, imaging, and chemical bleaching that can be completed in 2-5 days by researchers with basic laboratory skills. IBEX is compatible with over 250 commercially available antibodies and 16 unique fluorophores, offering remarkable flexibility for comprehensive tissue analysis.
A key advantage of IBEX is its open and flexible nature, allowing implementation on various imaging platforms using standard slides and non-proprietary imaging chambers. The protocol can be executed either manually or through an automated workflow using cost-effective instruments and reagents.
IBEX has been successfully applied to characterize complex tissue architectures and cellular ecosystems in both human and animal tissues, supporting initiatives like the Human Cell Atlas while providing valuable insights into tumor microenvironments and tissue histopathology.
The developers provide detailed protocols, validated antibody panels, and open-source image registration software to facilitate widespread adoption of this technology across academic and clinical research settings.
1.b. DNA Tags Technologies
While fluorescence-based protein detection methods have revolutionized tissue imaging, they face inherent limitations in multiplexing capacity due to spectral overlap between fluorophores. This constraint led to the development of DNA-tagging technologies that leverage the vast combinatorial potential of nucleic acid sequences rather than limited fluorescence channels.
In DNA-based methods, tissue preparation involves just a single staining step where antibodies conjugated with unique DNA oligonucleotide tags are applied to the sample.
-
After this initial staining, the detection process uses multiple rounds of imaging without requiring additional antibody applications.
-
During each imaging cycle, fluorescently labeled reporter probes that are complementary to specific DNA tags hybridize to their target sequences, generating detectable signals.
-
When these hybridization events occur, the resulting fluorescent patterns serve as unique identifiers for different proteins within the tissue.
-
Between imaging cycles, the reporter probes are removed through rapid chemical or enzymatic processes, allowing new probes to bind in subsequent rounds.
These technologies offer superior multiplexing capability (40+ parameters in a single experiment) and reduced photobleaching concerns compared to traditional fluorescence approaches. However, they typically require specialized instruments, proprietary reagents, and custom antibody conjugation, increasing technical complexity and cost.
Examples of DNA-based technologies include CODEX, ImmunoSABER, and HCR.
CODEX (2018)
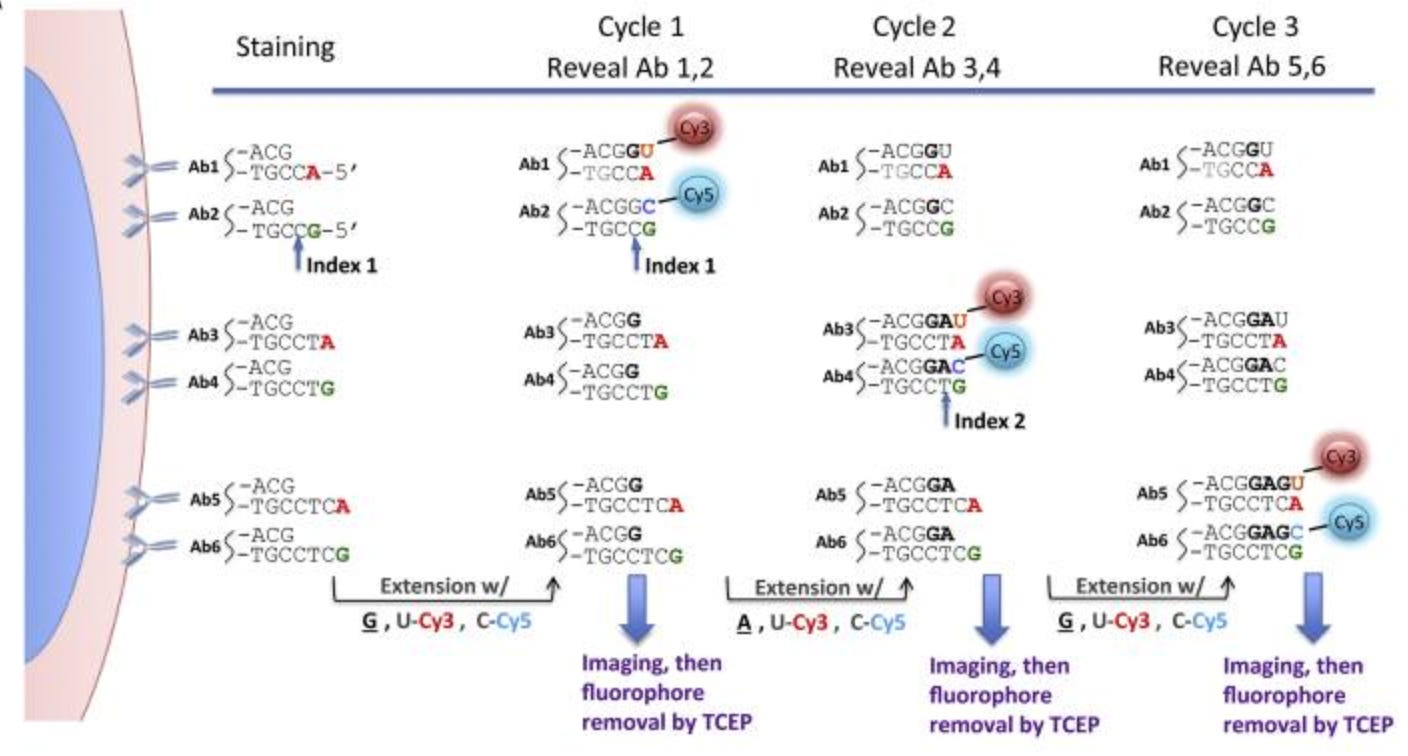
CODEX represents a different strategy to multiplexed protein imaging that uses DNA-barcoded antibodies and microfluidics for spatial protein profiling.
Unlike methods that require repeated antibody staining, CODEX performs a single initial staining step where all target proteins are labeled at once using antibodies conjugated to unique DNA barcodes. These barcoded antibodies do not carry fluorophores, making the tissue ready for iterative cycles of imaging without additional antibody application.
Using a microfluidics system CODEX is able to automate the introduction and removal of fluorescent DNA “reporter” oligonucleotides. Each cycle follows these steps:
-
A set of three fluorescently labeled DNA reporters, complementary to three specific antibody barcodes, is flowed into the sample via a microfluidic system. These reporters temporarily bind to their matching barcodes, making the corresponding protein targets fluorescent and visible under a microscope.
-
The sample is imaged, capturing the spatial distribution of the three selected protein markers.
-
A cleaving buffer (chaotropic solvent) is then introduced through the microfluidics system to strip away the fluorescent reporters, effectively removing the fluorescence signal while leaving the DNA-barcoded antibodies intact.
-
A new set of fluorescent reporters is flowed in, binding to a different set of three barcoded antibodies, and the cycle repeats.
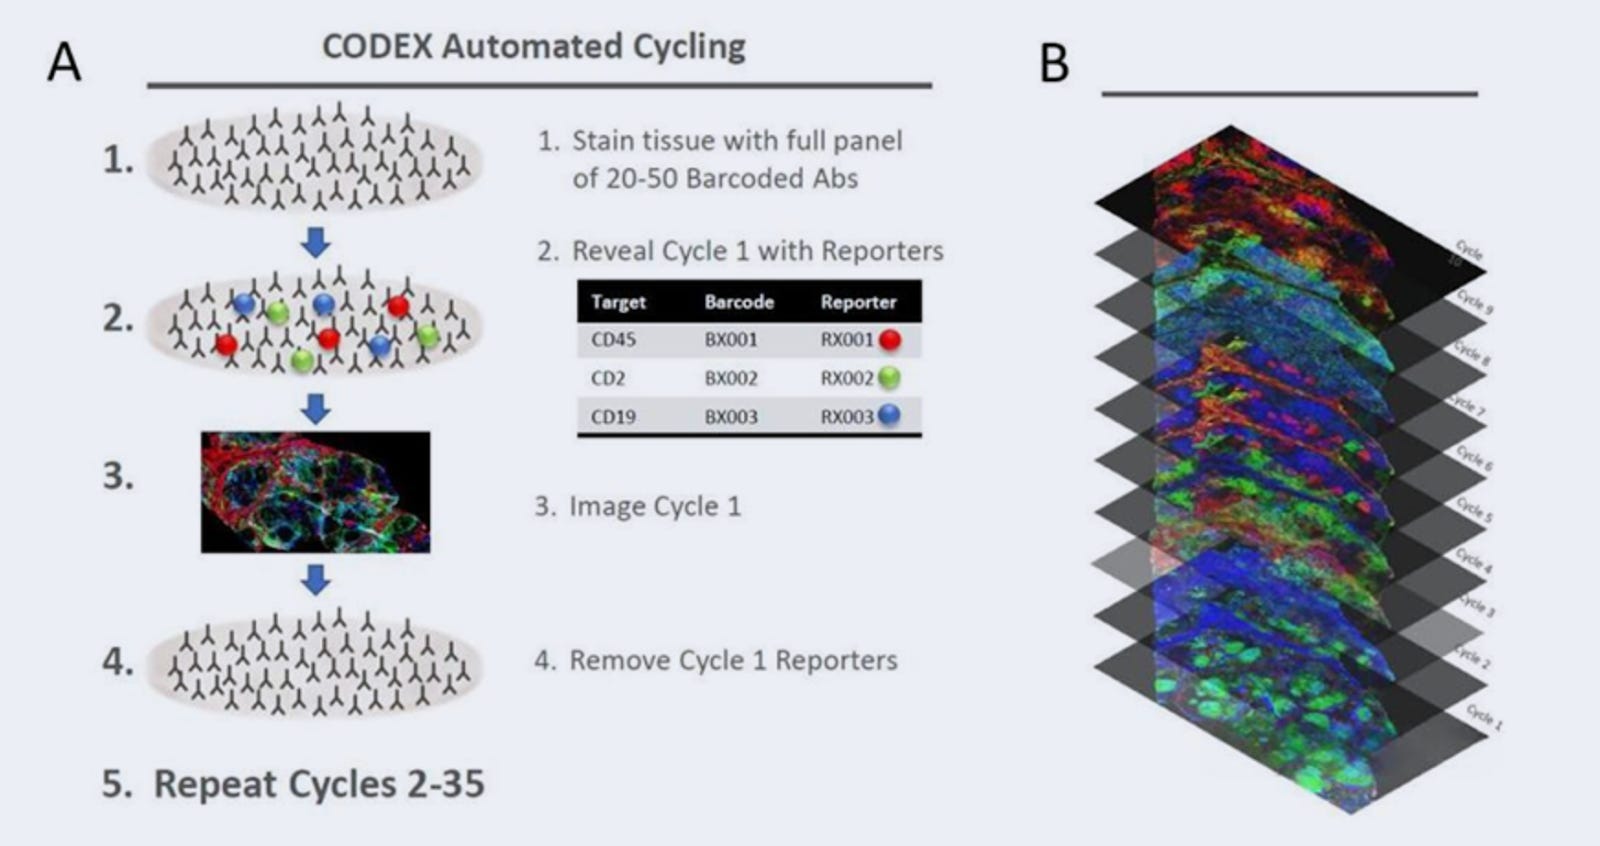
This iterative process continues until all markers in the antibody panel have been imaged. The final dataset is reconstructed by computationally aligning and merging the images from all cycles, creating a high-dimensional spatial protein map.
CODEX typically allows 40+ protein markers in one tissue, limited mainly by antibody availability. The technology has since been commercialized and expanded to detect 100+ proteins in a single tissue section while maintaining subcellular resolution.
ImmunoSABER (2019)
ImmunoSABER combines DNA-barcoded antibodies with programmable signal amplification to enhance detection sensitivity for low-abundance proteins, resulting in 10–100x signal amplification in comparison to traditional immunofluorescence techniques.
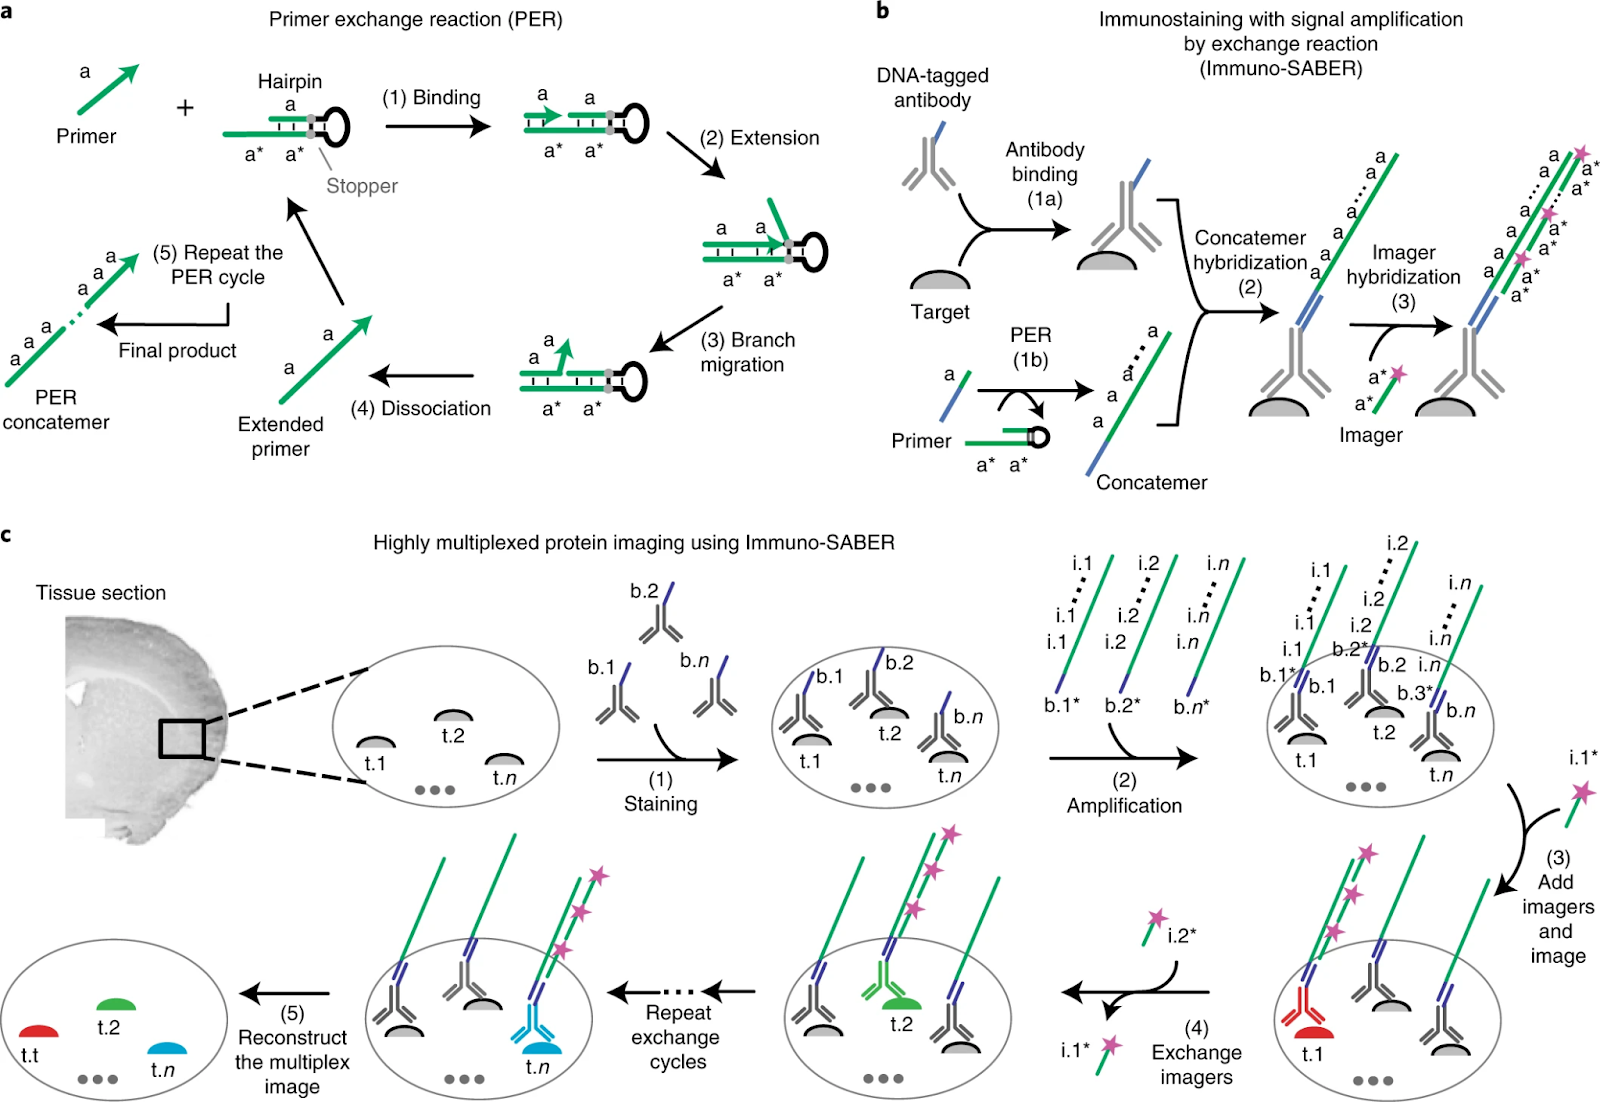
“SABER” stands for “Signal Amplification By Exchange Reaction”. In immuno-SABER, antibodies are conjugated with short DNA oligonucleotide handles. After binding these antibodies to the tissue, a DNA polymerization reaction is used to grow a concatemer (a long repeated DNA sequence) on each oligo handle. This concatemer has many repeated binding sites. Then, complementary fluorescently labeled oligonucleotide probes (imagers) are hybridized to the concatemers, resulting in amplified fluorescence signal (because each concatemer can bind many fluorescent probes). By designing different DNA sequences for different antibodies, multiple targets can be detected. The amplification increases sensitivity, enabling detection of low-abundance proteins which might be missed by direct IF. The DNA “imager” strands can also carry unique labels (like a sequence with a reporter for mass cytometry, see SABER-IMC below).
Immuno-SABER has been applied to immunofluorescence imaging where sensitivity is critical – e.g., detecting weakly expressed markers in tissues. It’s been used in multiplexed cell imaging, often in combination with cyclic methods: one can stain all antibodies (with DNA tags) at once, then sequentially introduce different fluorescent imagers to read out different targets. In a recent notable application, immuno-SABER was combined with Imaging Mass Cytometry (SABER-IMC) to amplify and detect 18 low-abundance immune markers in tumor tissues that standard IMC couldn’t see.
DEI (DNA Exchange Imaging)
DNA Exchange Imaging (DEI) is a high-speed multiplexed imaging method that, like CODEX, utilizes DNA-barcoded antibodies for spatial protein profiling. However, instead of using a microfluidics system to flow in and remove fluorescent DNA “reporter” strands (as in CODEX), DEI employs a rapid, manual exchange of fluorescent “imager” DNA strands. This approach eliminates the need for fluidics-based reagent delivery, significantly reducing cycle times.
The process begins with a single round of antibody staining, where all protein targets are labeled with DNA-barcoded antibodies. To visualize specific markers, a set of complementary fluorescently labeled DNA imager strands is manually introduced into the sample. These imager strands temporarily hybridize to their matching DNA barcodes on the antibodies, allowing fluorescence-based detection of a subset of targets.
Once a round of imaging is complete, a displacement buffer is quickly applied to remove the imager strands, erasing the fluorescence signal. A new set of fluorescent imager strands is then introduced, binding to a different subset of targets. Because the hybridization and displacement of short DNA oligos occur rapidly—on the order of seconds to minutes—each imaging cycle can be completed in under 10 minutes. This makes DEI much faster than CODEX, which relies on slower fluidics-controlled hybridization and wash steps.
Unlike some multiplexing methods that require antibody stripping and re-staining, DEI retains the same set of antibodies throughout the entire experiment. The only molecules being exchanged are the fluorescent imager strands, making it a non-destructive, high-throughput imaging technique. DEI has been demonstrated on both diffraction-limited and super-resolution microscopes (STED, SIM, PAINT), making it highly adaptable for various imaging applications.
However, DEI is currently mostly in the academic domain as a published method. It doesn’t have a turnkey commercial system like CODEX, so adoption requires setting up the workflow oneself.
DEI was applied to cultured cells and tissue sections to image a variety of cell structures. Wang et al. (2017) used it to map proteins in neurons and breast cancer cells, showing it could resolve ~10 synaptic proteins in cultured neurons and even do protein–protein colocalization analysis in situ. It has been used in super-resolution mode to study nanoclusters of proteins by exchanging DNA-PAINT probes, enabling multiplexed super-resolved imaging of cell structures at 20nm resolution.
HCR (Hybridization Chain Reaction) – First adapted for protein detection around 2017
Hybridization Chain Reaction (HCR) represents an elegant DNA-based signal amplification strategy that has been adapted for spatial protein detection. Originally developed for nucleic acid visualization, HCR employs a triggered chain reaction of DNA hybridization events to create long, fluorophore-labeled DNA polymers at sites where proteins of interest are located. The method begins with antibodies conjugated to DNA initiator sequences that can trigger the HCR amplification process.
When these DNA-tagged antibodies bind to their target proteins in tissue, they present initiator sequences that serve as nucleation sites for HCR amplification. The amplification involves two metastable DNA hairpin molecules that, upon encountering the initiator sequence, undergo a cascade of hybridization events, creating a long polymer of interlocked DNA strands. Each of these strands can carry multiple fluorophores, dramatically amplifying the signal from a single antibody-binding event. This amplification strategy enables detection of low-abundance proteins that might be missed by conventional immunofluorescence methods.
The programmable nature of DNA interactions allows for multiple orthogonal HCR amplification systems to operate simultaneously, enabling multiplexed protein detection with minimal crosstalk. In the seminal adaptation for protein detection by Koos et al., researchers demonstrated 5-10 fold signal enhancement compared to traditional methods, revealing previously undetectable protein expression patterns in complex tissues.
in situ Hybridization Chain Reaction (isHCR) (2020)
In situ Hybridization Chain Reaction (isHCR) is a specialized adaptation of HCR designed for in situ detection of biomolecules within intact tissues and cells. It follows the same core principle as HCR but is optimized for spatially resolved imaging of mRNA transcripts or protein targets in complex biological environments.
In isHCR, DNA or RNA probes are hybridized to target molecules directly within fixed tissues or cells. After washing away unbound probes, the HCR amplification process begins, generating a localized polymer chain at the site of the target. Since isHCR does not require enzymatic reactions or extensive sample processing, it is well-suited for tissue sections, whole-mount imaging, and even live-cell applications.
2. Sequencing-based Methods
Sequencing-based spatial proteomics represents a different approach that uses next-generation sequencing (NGS) rather than fluorescence microscopy to map protein distributions within tissues. These methods translate protein identity into DNA sequences through barcoded antibodies that bind specific targets in tissue sections. By linking these protein-identifying barcodes to spatial coordinate information, the technology creates molecular records that can be sequenced and computationally reconstructed into comprehensive protein maps. This NGS-based readout strategy overcomes the well-known spectral limitations of fluorescence methods, enabling simultaneous detection of hundreds to thousands of proteins.
Spatial CITE-seq
Spatial Cellular Indexing of Transcriptomes and Epitopes by Sequencing (Spatial CITE-seq) is an advanced multi-omics method that combines spatial transcriptomics with surface protein profiling in intact tissues. It builds upon CITE-seq (Cellular Indexing of Transcriptomes and Epitopes by sequencing), a technique that uses oligonucleotide-barcoded antibodies to simultaneously measure protein expression and mRNA levels in single cells.
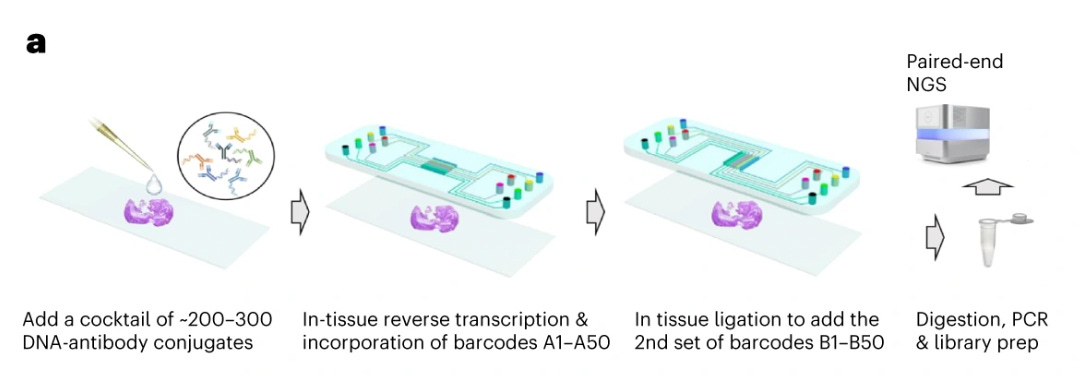
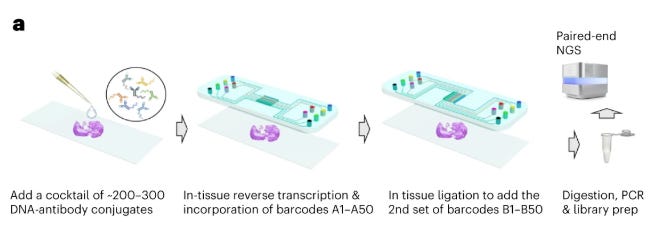
First, a thinly sectioned tissue sample is placed onto a spatial transcriptomics slide or microarray, typically one that contains a spatially barcoded RNA capture surface (e.g., AtlasXOmics DBiT-seq’s spatial barcoding kit). The sample is then incubated with a panel of DNA-barcoded antibodies, each targeting a specific surface protein. These antibodies allow for protein-level detection in addition to RNA sequencing. The tissue is permeabilized to release mRNAs, which bind to the spatially barcoded oligonucleotides on the slide. Simultaneously, the DNA-barcoded antibody tags remain associated with their respective cell locations.The mRNA and antibody-derived DNA barcodes are sequenced together using high-throughput sequencing. The spatial barcodes enable mapping of transcriptomic and proteomic data back to their original tissue locations. Finally, bioinformatics pipelines integrate these datasets to create a high-dimensional spatial map of both gene and protein expression.
The Spatial CITE-seq implementation, described by Liu et al. in 2023, was able to measure 273 proteins and transcriptome in human tissues, revealing spatially distinct germinal center reactions in tonsil and early immune activation in skin at the Coronavirus Disease 2019 mRNA vaccine injection site.
Molecular Pixelation
Immune cells play a fundamental role in disease mechanisms, driving inflammation, immune surveillance, and responses to infections and cancer. Understanding their behavior at the molecular level is critical for developing targeted therapies.
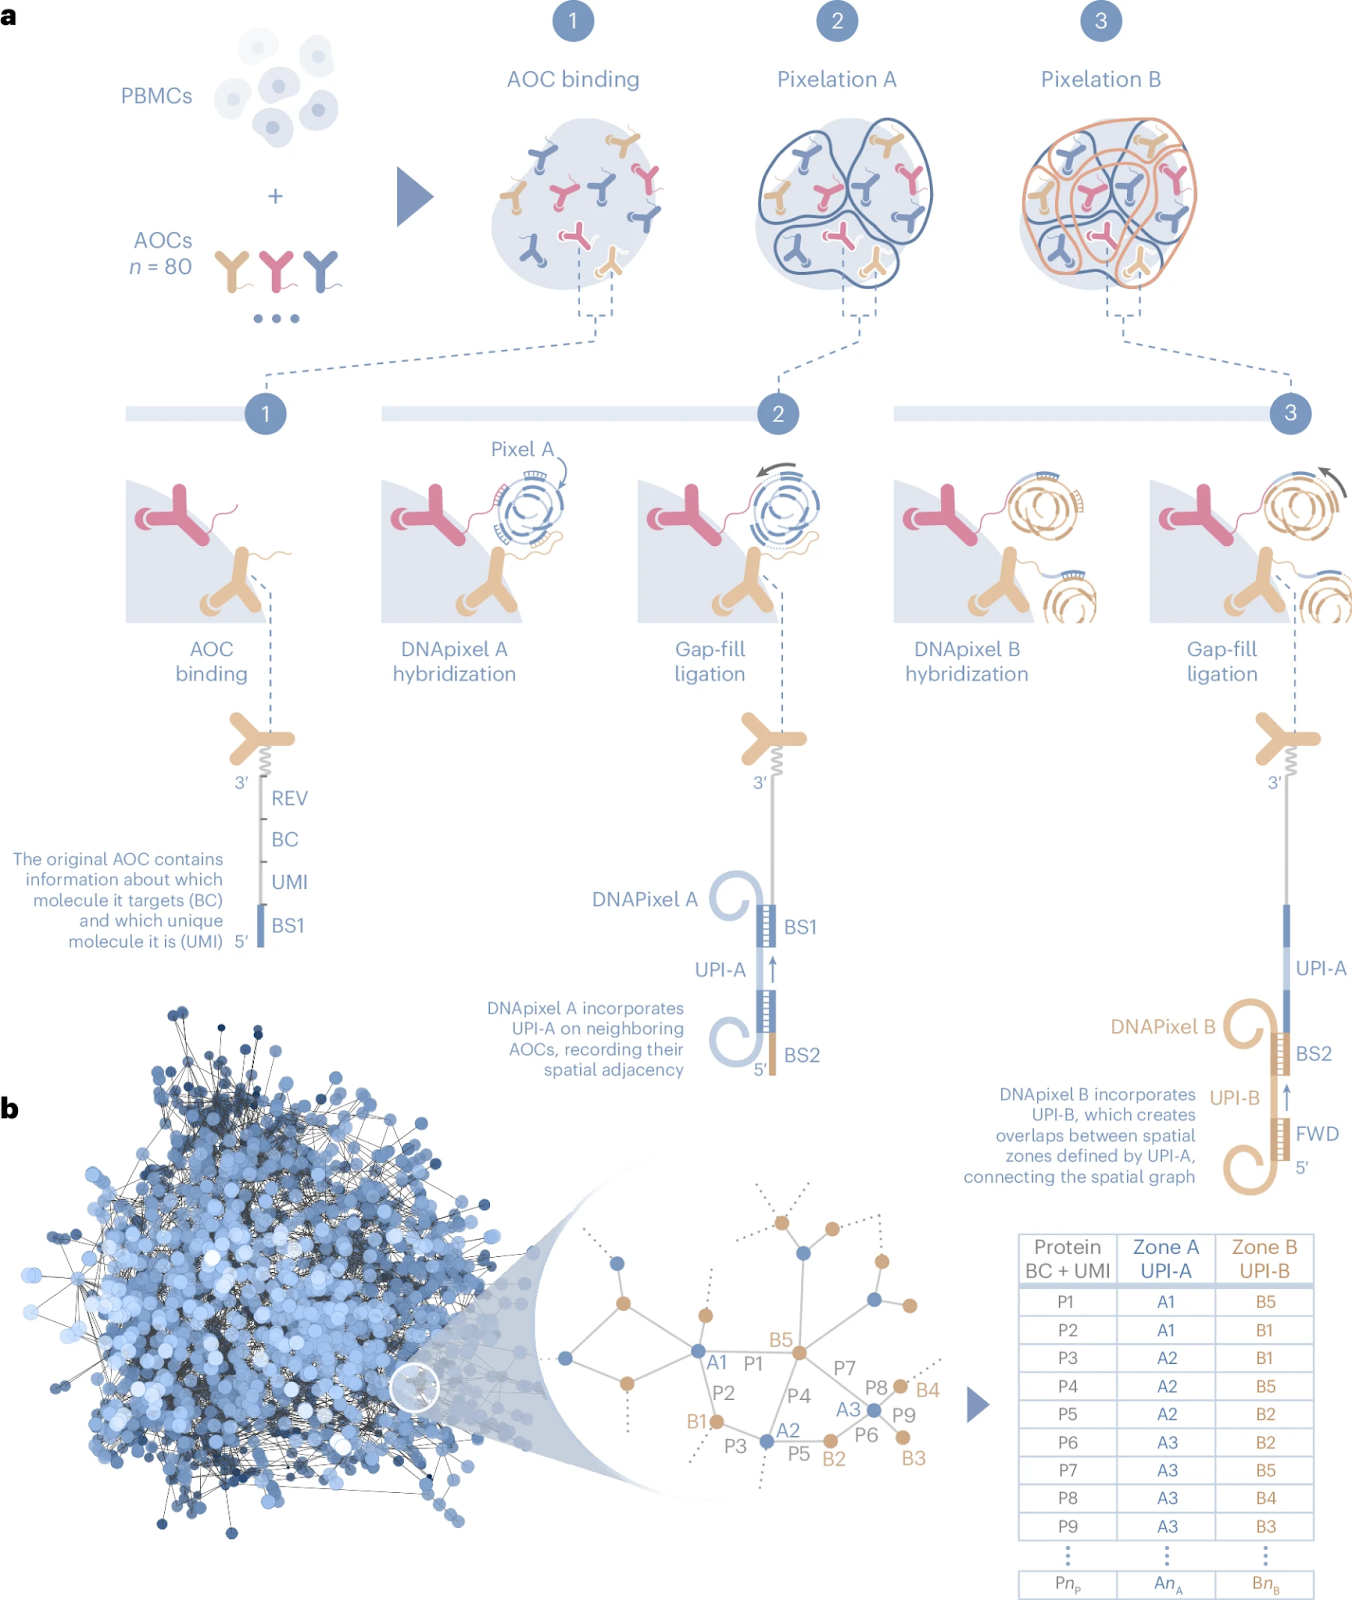
As such, Molecular Pixelation (MPX) is designed to provide a deep spatial analysis of immune cell surface proteins and their spatial interrelationships.
The workflow is based on a simple kit-based chemistry that can be performed in solution, eliminating the need for specialized instruments or single-cell compartmentalization. The process begins with peripheral blood mononuclear cells (PBMCs) or other immune cell types, which are first fixed with paraformaldehyde (PFA) to lock their spatial organization in place.
Cells are then incubated with antibody-oligo conjugates (AOCs) that are optimized and validated to bind specific cell surface proteins. These conjugates serve as the foundation for spatial barcoding, allowing precise molecular mapping of protein locations on each cell.
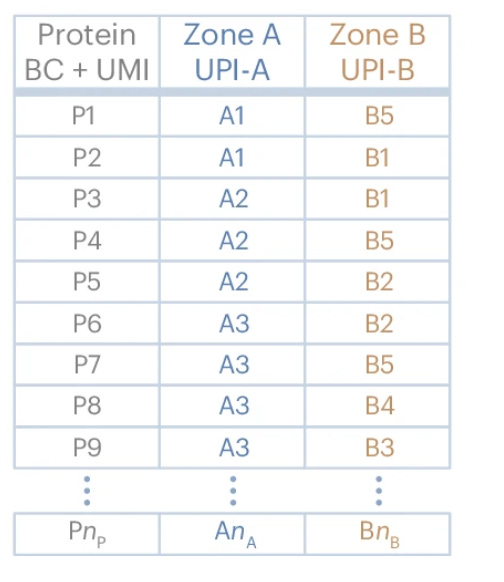
The core of MPX is the Pixelation process, which is conducted in two iterative steps. In “Pixelation A”, DNA-based molecular pixels—nanometer-sized repeat concatemers containing unique molecular identifiers (UMIs)—are introduced into the reaction. These molecular pixels hybridize with the antibody-conjugated oligonucleotide sequences, forming spatially localized DNA zones (Zone A) where specific proteins reside.
The process is repeated in Pixelation B, forming Zone B, which captures additional layers of protein spatial distribution. This results in a three-dimensional molecular mesh encoding protein positions relative to one another within each individual cell.
At the end of the reaction, the DNA-labeled proteins are converted into a PCR-amplifiable product, which is then sequenced using a next-generation sequencing (NGS) platform. Each single cell generates approximately 120,000 sequencing reads, providing an unprecedented level of spatial proteomic detail. The data is analyzed using Pixelgen’s Pixelator software, which reconstructs protein distributions, identifies cellular identities, and extracts key spatial metrics.
Unlike traditional flow cytometry, MPX’s software enables three key types of spatial proteomic analysis:
-
Protein abundance: Similar to flow cytometry or CyTOF, measuring the overall expression levels of proteins per cell.
-
Individual protein spatial distribution: Quantifying whether a single protein is randomly distributed, polarized, or clustered within the cell.
-
Polarity scores indicate whether a protein is organized (<0), clustered (>0), or randomly dispersed (=0).
-
Example: T cells stimulated via CD3 show polarized CD3 localization on one end of the cell.
-
-
Protein colocalization analysis: Determining how different proteins are positioned relative to each other on the same cell.
-
Colocalization scores range from <0 (segregated proteins) to >0 (proteins physically co-localized).
-
Example: Rituximab treatment of RAJI cancer cells polarizes CD20, a mechanism critical for CAR-T therapy and antibody-based drugs.
-
MPX provides spatial proteomic insights for up to 1,000 single cells per reaction, detecting 80 proteins per cell, with 80×80 colocalization events mapped per dataset. This enables researchers to study dynamic changes in the surface proteome in response to biological stimuli. A key example is T cell migration, where MPX reveals the polarized relocalization of CD50 when T cells move along an ICAM-1 coated surface with chemokine stimulation.
One of the most intriguing discoveries using MPX came from a study on CD4 T cells, where researchers compared stimulated vs. unstimulated cells. This revealed previously uncharacterized changes in the spatial organization of CD proteins, opening new avenues for immune system research and therapeutic targeting.
DSP
A well-known option for target region of interest (ROI)-based sequencing is GeoMx, which can profile the whole transcriptome and 600+ proteins simultaneously.
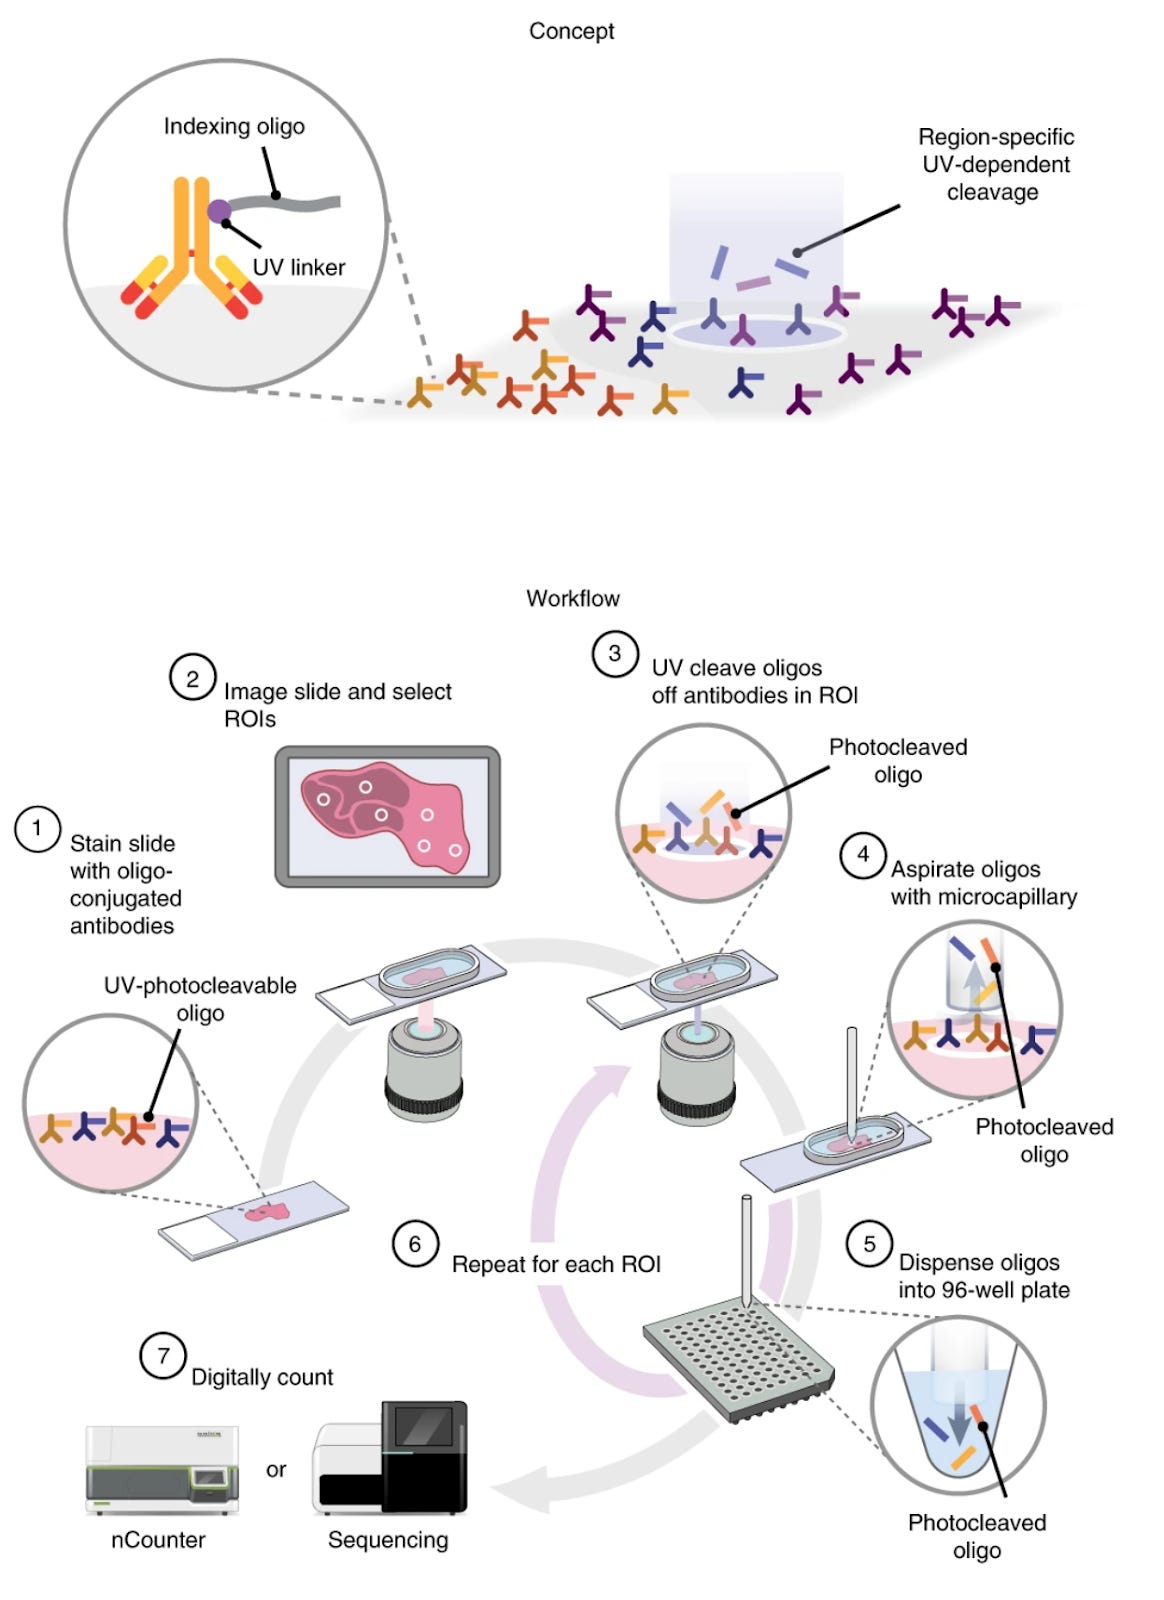
In DSP, tissue sections are stained with a cocktail of either oligonucleotide-barcoded antibodies or RNA hybridization probes, each probe carrying a unique DNA barcode and a photocleavable linker. The tissue is placed in the instrument, and regions of interest (ROIs) are selected (either by manual selection, predefined grid, or automated segmentation). UV light is then directed to each ROI in turn, which cleaves the DNA barcodes from the probes only in that illuminated area. These released DNA barcodes are collected and counted (either by next-generation sequencing or NanoString optical barcoding instrument nCounter) to quantify the expression of targets in that ROI.
In cancer research, an interesting discovery came from applying DSP to melanoma samples, where researchers identified distinct immune contextures that predicted response to immunotherapy. The original work by Merritt et al. revealed that effective anti-PD-1 therapy was associated not simply with T cell abundance, but with specific spatial arrangements of PD-1+ T cells relative to PD-L1-expressing tumor cells and myeloid populations, highlighting the importance of spatial proximity in immune checkpoint biology. Further, DSP analysis of COVID-19 lung tissues (Desai et. al, 2020) provided crucial insights into the pathogenesis of severe disease, revealing specialized damage-associated molecular niches where virus-infected cells exhibited distinct protein signatures that orchestrated aberrant immune responses. These spatially-restricted interaction zones helped explain the paradoxical coexistence of immune hyperactivation and immunosuppression observed in severe cases.
3. Mass Spectrometry-based Methods
Mass spectrometry (MS) provides a powerful means to analyze proteins within intact tissues, adding a complementary perspective to imaging- and sequencing-based spatial methods. Unlike conventional immunofluorescence imaging, which relies on a limited number of antibody labels, MS can detect hundreds of molecules in tissue without any labels or a priori target selection. This label-free capability allows MS-based spatial proteomics to map a broad molecular landscape (proteins, peptides, metabolites) in a single experiment, avoiding the spectral overlap and throughput limitations of fluorescence microscopy.
Mass spectrometry-based spatial proteomics approaches fall into two broad categories:
-
Label-free methods: These analyze tissues for their intrinsic protein content by ionizing molecules and measuring their mass-to-charge signatures
-
Metal-tagged methods: These combine immunohistochemistry with MS detection, using antibodies carrying metal isotopes instead of fluorophores
Label-free approaches are essentially untargeted (discovery-driven, detecting whatever proteins are present above the detection limit), whereas metal-tagged assays are targeted (each metal reporter corresponds to a specific antibody-labeled protein).
3.a. Label-Free Mass Spectrometry Approaches
Label-free spatial proteomics uses the inherent mass and charge properties of proteins or peptides to identify and map them in tissue. In these approaches, proteins from a tissue section are directly ionized and detected by the mass spectrometer, producing spectra of mass-to-charge features that correspond to different biomolecules. Because no labeling is needed, label-free MS can simultaneously detect a vast array of molecules, providing an unbiased view of the tissue’s molecular composition.
There are two main modes to perform label-free spatial proteomics: LC-MS/MS and Imaging Mass Cytometry.
LC-MS/MS
Small regions of tissue (such as microdissected cells) are excised or isolated, then processed for conventional proteomic analysis. The proteins are typically digested into peptides and separated by liquid chromatography, followed by tandem MS identification. This workflow yields a detailed proteomic profile of specific locations, often identifying hundreds or thousands of proteins from a tiny pieces of tissue. Its strength lies in sensitivity and depth, but it’s relatively low-throughput spatially since each location must be sampled and run separately.
Many technologies have emerged to increase the throughput of LC-MS. Examples include MASP, scDVP, and LCM-SISPROT.
LCM-SISPROT
In 2018, Xu et al. introduced LCM-SISPROT, a spatial proteomics approach designed to analyze specific pathological regions based on H&E staining. The method begins with H&E-stained tissue slides, which are carefully examined by an expert pathologist to assess cellular and morphological features. Using these annotations, regions of interest (ROIs) are precisely microdissected with a Leica LMD system for downstream proteomic analysis.
A key innovation of LCM-SISPROT is its two-stage Spintip-based processing, which effectively removes H&E staining dyes while preserving protein integrity. This allows for the extraction of spatially distinct proteomes from different cell types within the same tissue section, including enterocytes, lymphocytes, and smooth muscle cells. By applying this method across four consecutive tissue sections, Xu et al. successfully generated spatially resolved proteomic profiles at a micrometer scale. Notably, they identified over 500 proteins from a minute colon cancer tissue sample measuring just 0.1 mm² in area and 10 µm thick.
MASP: Micro-Scaffold Assisted Spatial Proteomics
In 2022, Ma et al. developed Micro-Scaffold Assisted Spatial Proteomics (MASP), an approach that enhances spatial proteomics by integrating 3D-printed micro-scaffolds for localized protein capture, preservation, and enzymatic processing. Unlike conventional spatial proteomics techniques that rely on laser microdissection or direct tissue digestion, MASP physically compartmentalizes tissue regions within a structured scaffold, ensuring that proteins are processed in situ while maintaining their spatial organization. The result is a mouse brain tissue that was divided into hundreds of 400 µm × 400 µm voxels, with over 5000 proteins detected in each voxel. Using this approach, the authors developed a spatial proteomic atlas of Alzheimer’s disease in a mouse cerebral cortex.
scDVP: Single-Cell Deep Visual Proteomics
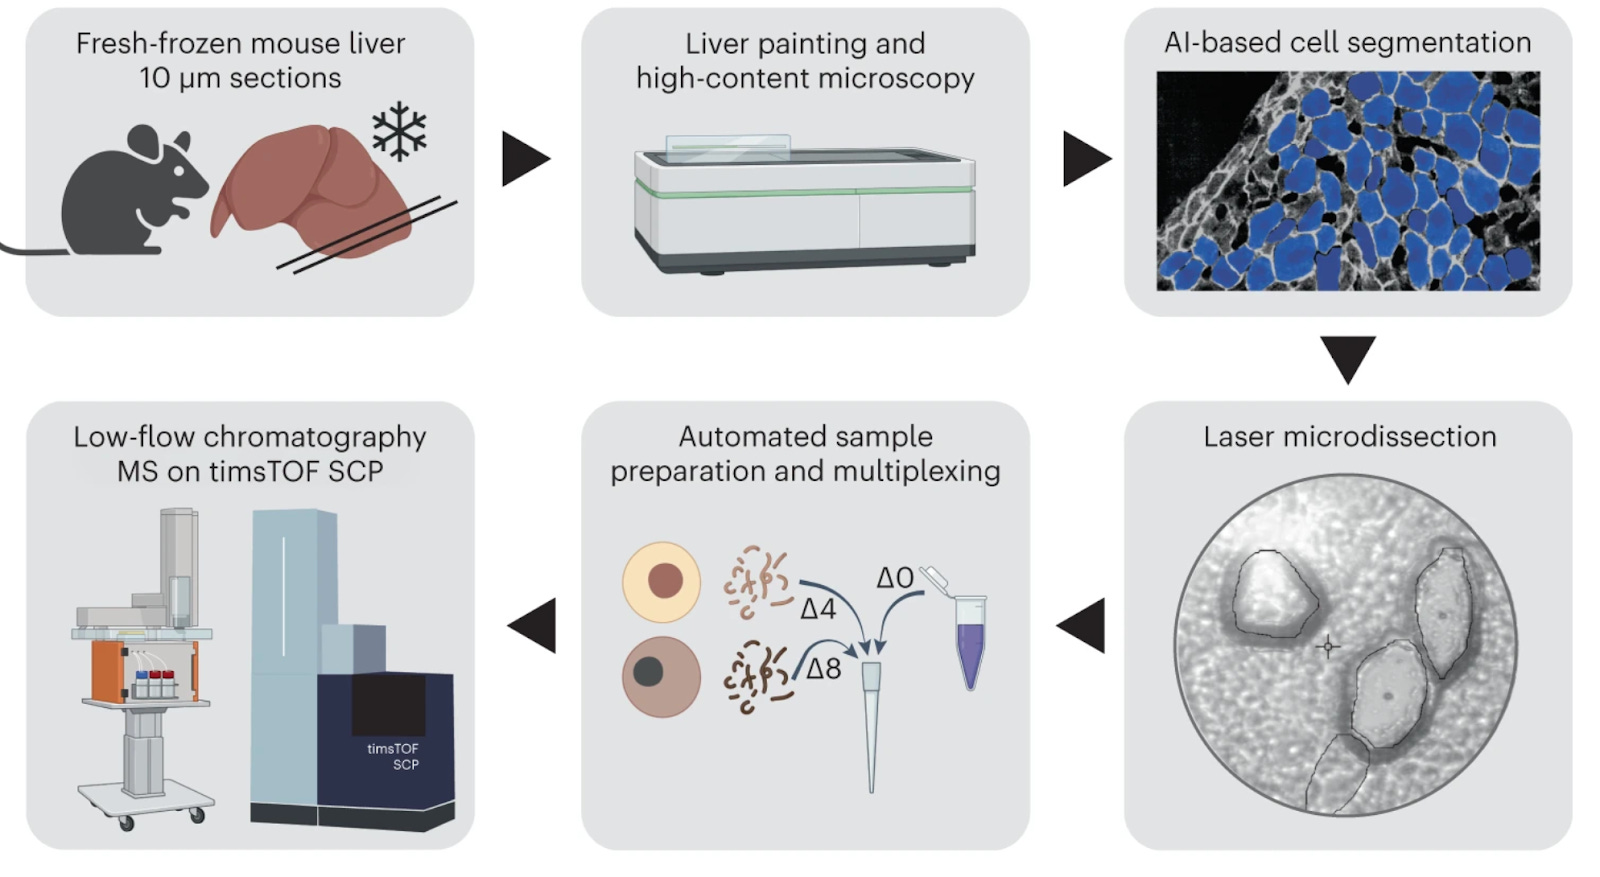
Single-Cell Deep Visual Proteomics (scDVP) (Rosenberger et. al, 2023) is an advanced approach that combines high-resolution imaging with single-cell proteomics, allowing researchers to identify and quantify proteins in individual cells while retaining information about each cell’s location and phenotype. This method, often referred to simply as Deep Visual Proteomics (DVP), integrates the strengths of microscopy and mass spectrometry into one pipeline.
First, a tissue section (or cell culture) is imaged in detail – for example, using microscopy with fluorescence or histological stains – to visualize cell morphology and context.
Artificial intelligence-driven image analysis is then used to segment the image and recognize cells or regions of interest based on their appearance (for instance, cell shape, size, or marker intensity).
scDVP next employs automated laser capture microdissection to physically isolate those target cells, one cell at a time, directly from the tissue slide. Each isolated single cell (or nucleus) is subjected to an ultrasensitive sample preparation and MS analysis, typically using optimized single-cell proteomics workflows (e.g. specialized lysis and nanoLC-MS).
Finally, the proteomic data from each cell is linked back to its imaging data and location. This yields a rich output: one can correlate microscopic phenotypes (such as cell type, histological features, or spatial position) with the deep proteome of the same single cell. As a result, scDVP was able to identify a maximum of 2769 proteins in a single cell.
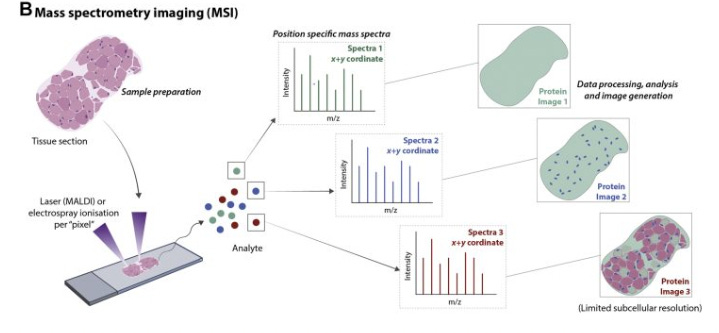
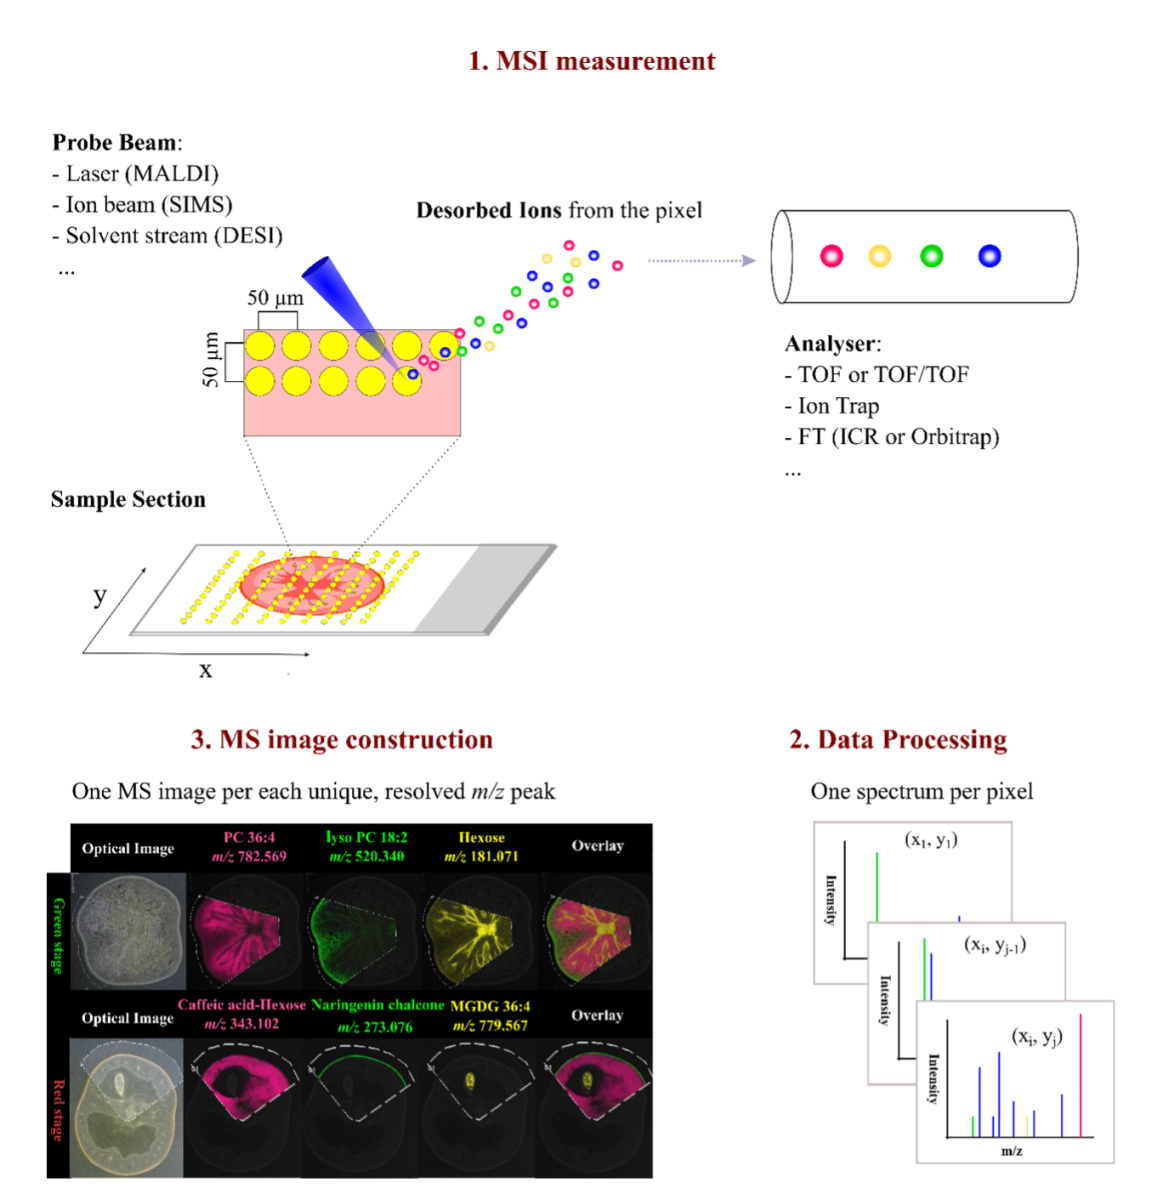
Imaging Mass Spectrometry (IMS)
Unlike LC-MS/MS methods, which require microdissection and protein digestion before tandem MS analyses, IMS acquires data across an entire tissue section in a rasterized fashion, yielding a map of ion signals at each x,y coordinate.
The tissue is analyzed intact on a slide: the instrument’s probe moves across the sample, analyzing countless tiny spots (pixels) and recording the intensity of each mass-to-charge ratio at each spot. The result is a set of ion images, where each image represents the spatial distribution of a particular molecule in the tissue. This approach preserves continuous spatial information similarly to a microscope image, albeit with the rich molecular content that MS provides.
Two Approaches for IMS: Top-down vs. Bottom-up
IMS can be further divided into two key approaches: top-down and bottoms-up.
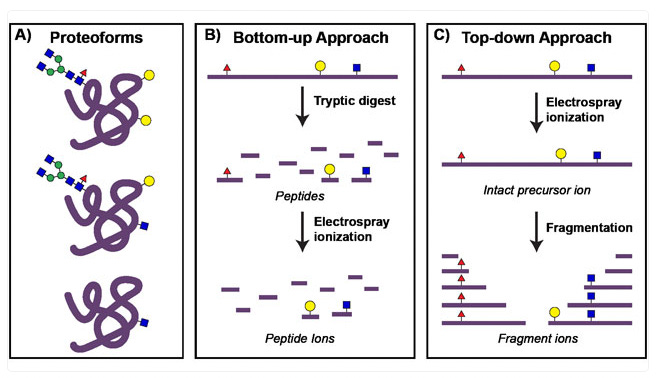
Top-down IMS
Top-down imaging mass spectrometry (IMS) detects intact biomolecules—proteins, lipids, and metabolites—directly from tissue without prior digestion. This approach preserves molecular structures and post-translational modifications (PTMs), making it ideal for mapping spatial distributions of biomolecules in situ.
MALDI-MSI
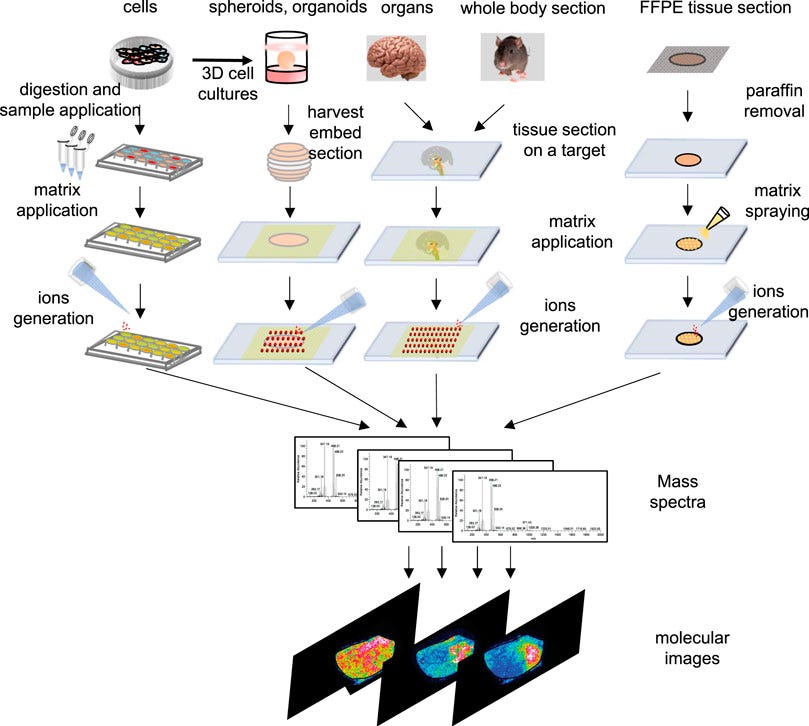
A prime example is MALDI-MSI (Matrix-Assisted Laser Desorption/Ionization Mass Spectrometry Imaging), which has become one of the most widely used label-free IMS methods. In MALDI-MSI, the tissue is coated with a matrix compound and a laser beam is fired in a grid pattern across the section. The laser’s energy, absorbed by the matrix, causes nearby biomolecules to desorb and ionize. MALDI can detect a range of biomolecules (from small metabolites up to proteins of ~20–30 kDa) with high sensitivity. Recent advancements such as MALDI-2, which introduces a secondary laser pulse to enhance ionization, have further improved sensitivity and resolution.
DESI

Other top-down IMS techniques operate on similar principles but with different ionization mechanisms. For instance, DESI (Desorption Electrospray Ionization) uses a stream of charged micro-droplets directed at the tissue; as the solvent impacts the surface, it lifts off molecules, which then enter the MS.
A variant called nanoDESI uses a nanoscale solvent junction for finer control: two tiny capillaries create a micro-droplet that scans the surface, achieving improved sensitivity and lateral resolution over standard DESI. Indeed, nanoDESI has demonstrated spatial resolution below 10 µm for imaging lipids in tissue, a significant improvement given that older DESI setups were often limited to ~100 µm scale
LESA
LESA (Liquid Extraction Surface Analysis) is another powerful tool in top-down IMS. In this technique, a robotic pipette deposits a small solvent droplet onto a tissue section, then re-aspirates it to extract biomolecules for mass spectrometry analysis. LESA is particularly advantageous for extracting intact proteins and metabolites while allowing tandem MS (MS/MS) analysis for deeper molecular characterization. Although LESA lacks the high spatial resolution of MALDI or DESI, it enables solution-phase proteomics with enhanced analytical depth.
Overall, top-down IMS techniques provide diverse capabilities for molecular imaging. MALDI and nanoDESI enable high-resolution, in situ imaging, making them suitable for lipidomics and small-molecule analysis. In contrast, LESA offers higher analytical depth at the cost of spatial resolution, making it well-suited for proteomics applications that require detailed molecular characterization.
Bottom-up IMS
In contrast to top-down IMS, bottom-up imaging mass spectrometry (IMS) incorporates an enzymatic digestion step to analyze peptides rather than intact proteins in situ. In these workflows, a tissue section is treated with a protease—typically trypsin—to cleave proteins into peptides directly on the slide. These peptides, being smaller and more amenable to tandem mass spectrometry (MS/MS) sequencing, produce more identifiable fragment ions than intact proteins, improving protein identification and spatial mapping. While this method enhances the number of proteins detected, it does not retain information on intact protein structures or post-translational modifications as effectively as top-down approaches.
The same ionization technologies used in top-down IMS—MALDI, DESI, nanoDESI, and LESA—are also applicable in bottom-up IMS, but with a focus on detecting peptides rather than intact biomolecules. MALDI-MSI, for example, remains a core technique, but instead of detecting whole proteins, it ionizes digested peptides for spatially resolved MS/MS sequencing. This allows researchers to generate peptide maps of tissue sections, significantly improving protein identification over direct intact protein detection.
3.b. Metal-Tagged Mass Spectrometry Approaches
Metal-labeled imaging approaches use antibodies tagged with metal isotopes instead of fluorophores. The readout is performed by mass spectrometry, allowing dozens of different metal tags to be detected in parallel without spectral overlap. Two main implementations exist: laser ablation inductively coupled plasma mass spec (Imaging Mass Cytometry, CyTOF-based) and ion beam imaging mass spec (MIBI).
-
Imaging Mass Cytometry (IMC)
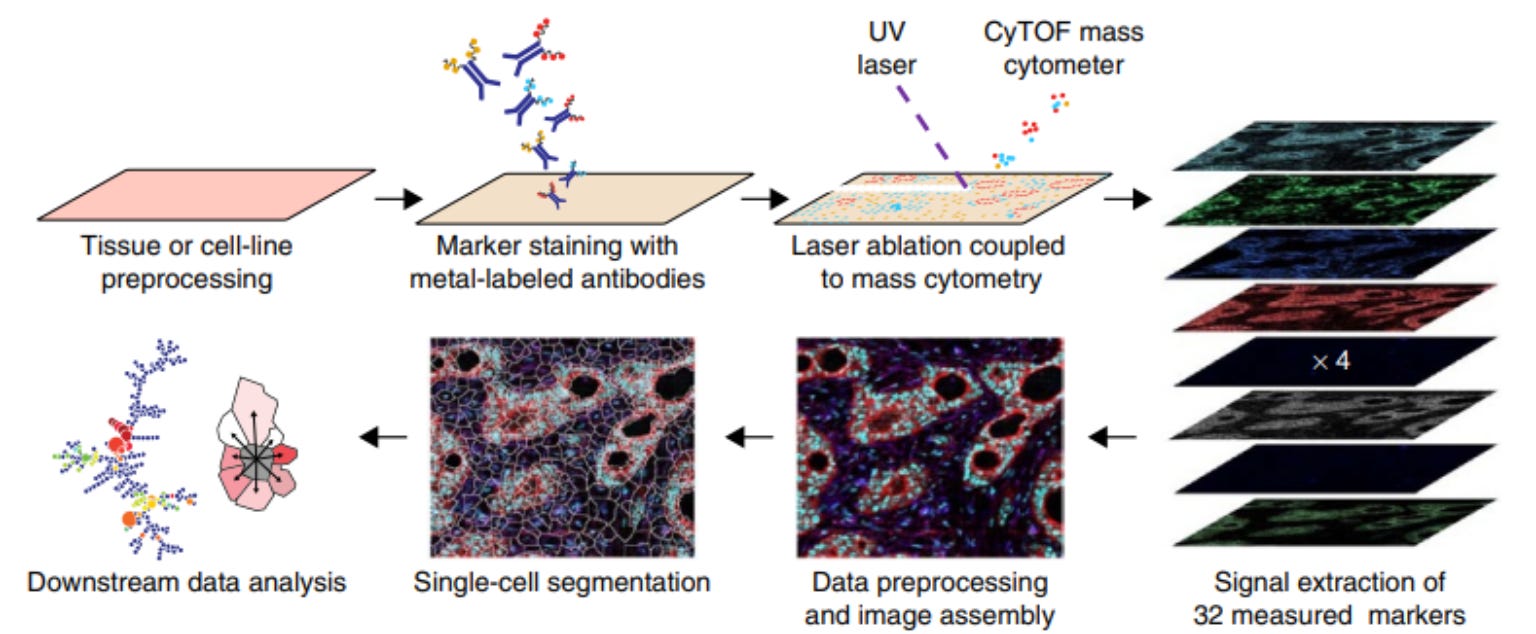
IMC, developed by Fluidigm (now Standard BioTools), adapts CyTOF mass cytometry for imaging applications. A focused laser (UV ablation) scans across the tissue, vaporizing microscopic regions (~1 µm spots). The resulting plume of ablated material is carried into the CyTOF time-of-flight (TOF) mass spectrometer, where metal tags are detected and quantified. IMC provides single-cell resolution, allowing researchers to visualize cellular organization and protein expression in complex tissues. The technique comes with the advantage of high multiplexing (~40 markers), single-cell resolution, and no spectral interference. On the other hand, the laser fully ablates the sample, preventing rescanning or additional downstream analysis.
-
Multiplexed Ion Beam Imaging (MIBI)
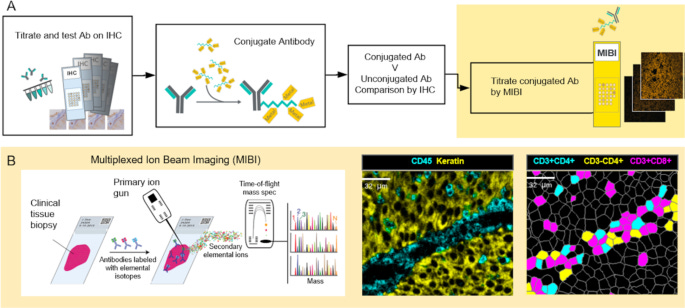
MIBI, developed by IonPath, employs an ion beam (e.g., oxygen duoplasmatron) instead of a laser to sputter the surface of the tissue pixel by pixel. This dislodges metal-labeled ions, which are then analyzed by a TOF mass spectrometer, similar to IMC. Unlike IMC, MIBI allows multiple scans of the same region, as only a thin layer of tissue is removed per pass. One advantage of MIBI is the flexible resolution tuning (from whole-tissue to subcellular scales), rescan capability, and reduced sample consumption. On the other hand, is also has slightly slower acquisition speed compared to IMC due to pixel-by-pixel sputtering.
Both techniques generate high-dimensional tissue maps, where each metal isotope corresponds to a protein, and its intensity at each XY coordinate represents local abundance. The resulting datasets resemble multiplexed immunofluorescence images but without the constraints of fluorescence-based methods.
Over the past decade, many advances have been built on top of these two foundational technologies. We proceed by reviewing these developments below:
SABER-IMC
SABER-IMC is a hybrid method that combines DNA-mediated signal amplification (immuno-SABER) with Imaging Mass Cytometry (IMC).
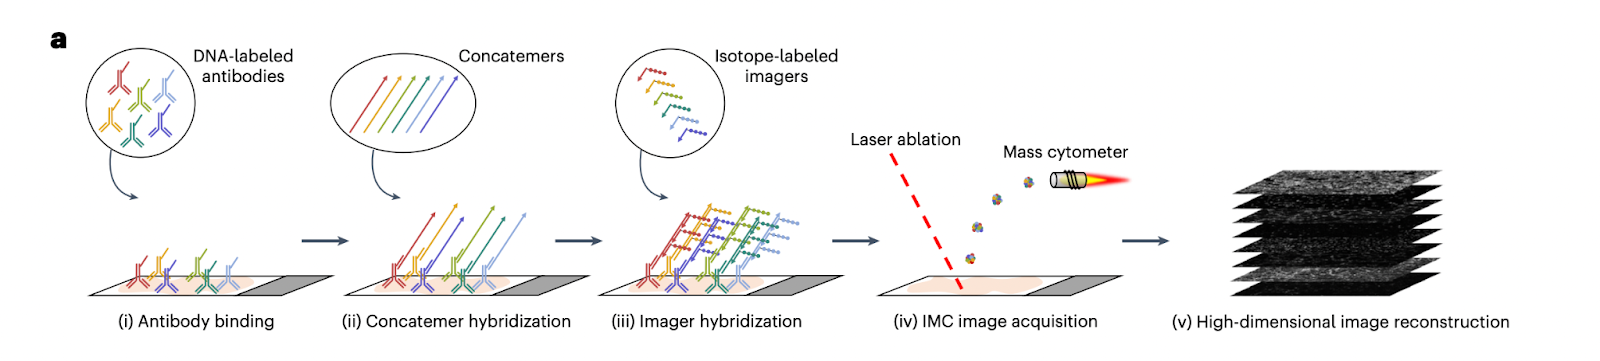
In standard IMC, one limitation is that very low-abundance proteins may fall below detection threshold. SABER-IMC addresses this by first performing immuno-SABER: antibodies for selected low-abundance targets carry DNA concatemers (via the SABER method, see above) to amplify the number of DNA binding sites. Next, instead of fluorescent imagers, those DNA concatemers are hybridized with isotope-labeled oligonucleotide probes. These metal-containing probes bind in large numbers to each concatemer, effectively loading lots of metal atoms at each target site. Then the sample is run on an IMC instrument: a laser ablates the tissue and the plume is analyzed by a CyTOF mass cytometer, detecting both the standard metal-tagged antibody signals and the DNA-bound isotope signals. This way, markers enhanced by SABER show greatly boosted signal counts in the mass cytometry readout. SABER-IMC typically is used in a mode where some markers (maybe 10–20) are amplified and others (20–30) are done conventionally, achieving ~30–50-plex in total.
SABER-IMC has been applied to human tumor samples to reveal biomarkers that were previously undetectable by IMC alone. For example, in a melanoma study, 18 low-expression proteins (such as certain T cell co-receptors and ligand proteins) were successfully imaged with SABER amplification, alongside 20 regular markers. This allowed identification of immune cell subpopulations that would have been missed by standard IMC.
HD-MIBI
HD-MIBI is an advancement of MIBI that achieves much higher spatial resolution (down to ~30–50 nm) at the cost of multiplexing or area size. This is achieved by using a finer primary ion beam and optimized instrument settings to get very small sputter spots. As a result, HD-MIBI can zoom in on tiny structures (for example, subcellular distributions of drugs or signaling molecules) that standard MIBI cannot resolve. The time-of-flight mass spectrometer still detects multiple isotopes, but because of the much smaller beam and slower sputter, typically fewer markers (maybe 6–8) are practical and areas imaged are relatively small.
HD-MIBI has been used to study subcellular localization of molecules like pharmaceuticals within cells in tissue. For instance, it can visualize a drug and a couple of proteins in a cell to see if the drug is penetrating the nucleus or stuck in vesicles. It’s also useful for examining microdomains in tissues, e.g., membrane protein clusters, synapses, etc., where 50 nm resolution illuminates spatial relationships beyond light microscopy.
Metal-tagged spatial proteomics marries the specificity of antibody-based targeting with the multiplexing and quantitative abilities of mass spectrometry. In these methods, the spatial localization comes from antibodies binding their target proteins in the tissue, and the readout comes from detecting attached metal isotopes via MS. The general workflow is analogous to an immunohistochemistry (IHC) stain, but instead of chromogenic or fluorescent labels, each antibody is conjugated to a unique metal isotope tag (often a lanthanide rare-earth metal). After the tissue is incubated with a cocktail of, say, 30 or 40 different metal-labeled antibodies, it is introduced into an imaging mass spectrometer that can detect those metals with spatial fidelity
Comparison between Commercial Solutions
Below, we present an overview of 14 spatial proteomics products on the market and a comparison of their attributes.
Number of Targets & Throughput
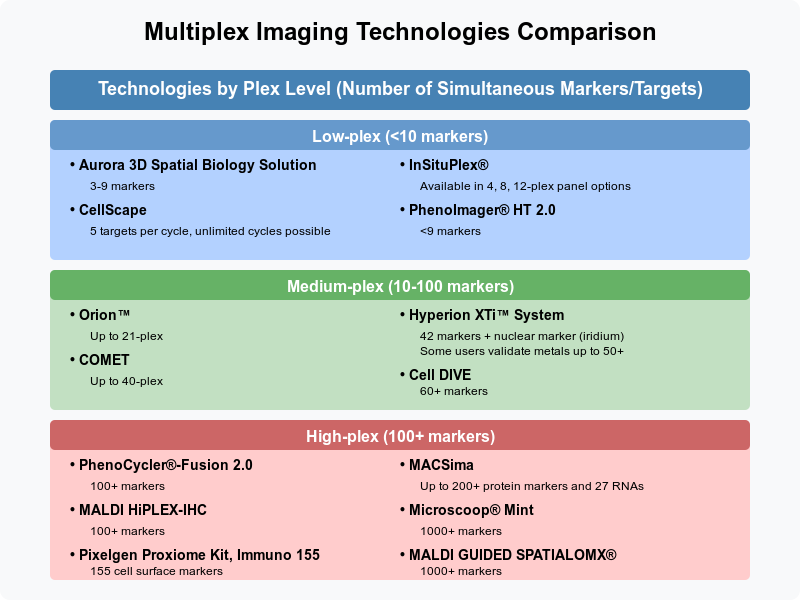
All products can be loosely grouped into three categories:
One key consideration when choosing low vs. high-plex spatial proteomics methods is the type of study and biological questions one wishes to carry out.
Low-plex platforms are ideal for targeted studies, such as validating specific biomarkers or conducting routine clinical diagnostics at fast speed. For example, Akoya Biosciences’ PhenoImager can process a whole-slide 6-plex in <12 minutes and hundreds of samples per week with high reproducibility and robust data quality. This is especially crucial for high-throughput translational studies and clinical trials where biomarker signatures need to be analyzed across large cohorts of patient samples. InSituPlex, when used with Leica Biosystems' BOND RX automated research stainer, allows for processing up to 30 tissue sections in <6 hours.
Medium-plex platforms, which support 21 to 60 markers, provide a balance between depth and throughput, making them suitable for tumor microenvironment studies, immune-oncology research, and functional tissue analysis. These systems allow for a more comprehensive view of cell interactions while keeping data complexity manageable.
For studies requiring deep profiling of cellular interactions and molecular states, high-plex platforms provide the most comprehensive insights. These systems support over 100 markers, allowing researchers to explore vast biological landscapes in a single experiment. PhenoCycler®-Fusion 2.0 and MALDI HiPLEX-IHC can both detect over 100 biomarkers, while the Pixelgen Proxiome Kit, Immuno 155 is specifically designed for cell surface marker colocalization, featuring 155 pre-designed surface protein markers. MACSima expands on this, enabling the simultaneous detection of over 200 protein markers and 27 RNA targets, offering multiomic capabilities within a single assay. At the highest end of the spectrum, Microscoop® Mint and MALDI GUIDED SPATIALOMX® extend detection to 1,000+ markers, making them particularly valuable for hypothesis-free research. On the other hand, these systems may take more than a single day, sometimes multiple days, to go from raw samples to data.
Panel Flexibility and Customization for Antibodies
A major challenge in antibody-based spatial proteomics is ensuring specificity and reproducibility across multiple markers. Poorly validated antibodies can cause cross-reactivity and signal interference, making pre-defined, validated panels crucial for reliable results, especially in immuno-oncology (IO) and tissue-specific studies.
Many platforms offer ready-to-use antibody panels optimized for FFPE and fresh-frozen tissues. Aurora 3D Spatial Biology Solution is has a predefined panel specifically for dermatology, for example, while Pixelgen Proxiome Kit, Immuno 155 specializes in immune cell surface marker colocalization with 155 pre-designed markers.
We provided a summary table above to link and redirect eaders to specific companies’ website. It is important to check out if your tissue, species, and biomarkers of interest belong to the list of optimized, pre-defined panels at each company. We recommend evaluating these panels early in the experimental design process to streamline workflow setup and minimize validation challenges.
Tissue Types
The majority of providers support fresh/frozen, FFPE, and tissue microarrays. Pixelgen requires sample inputs to be fixed cells in suspension originating from PBMCs, BM, dissociated organoids, or fresh frozen tissue.
The Aurora 3D™ Spatial Biology Solution by Alpenglow Biosciences is currently the only platform that enables comprehensive 3D protein profiling of intact tissues, while most other platforms work with tissue slices that are 5-10 microns thick.
Maximum Scan Area per Run
(Caveat: We couldn't find scan area and slide capacity details for Aurora 3D Spatial Biology Solution, Microscoop® Mint, MALDI HiPLEX-IHC, MALDI GUIDED SPATIALOMX®, and InSituPlex®, so our comparison includes only platforms with available data.)
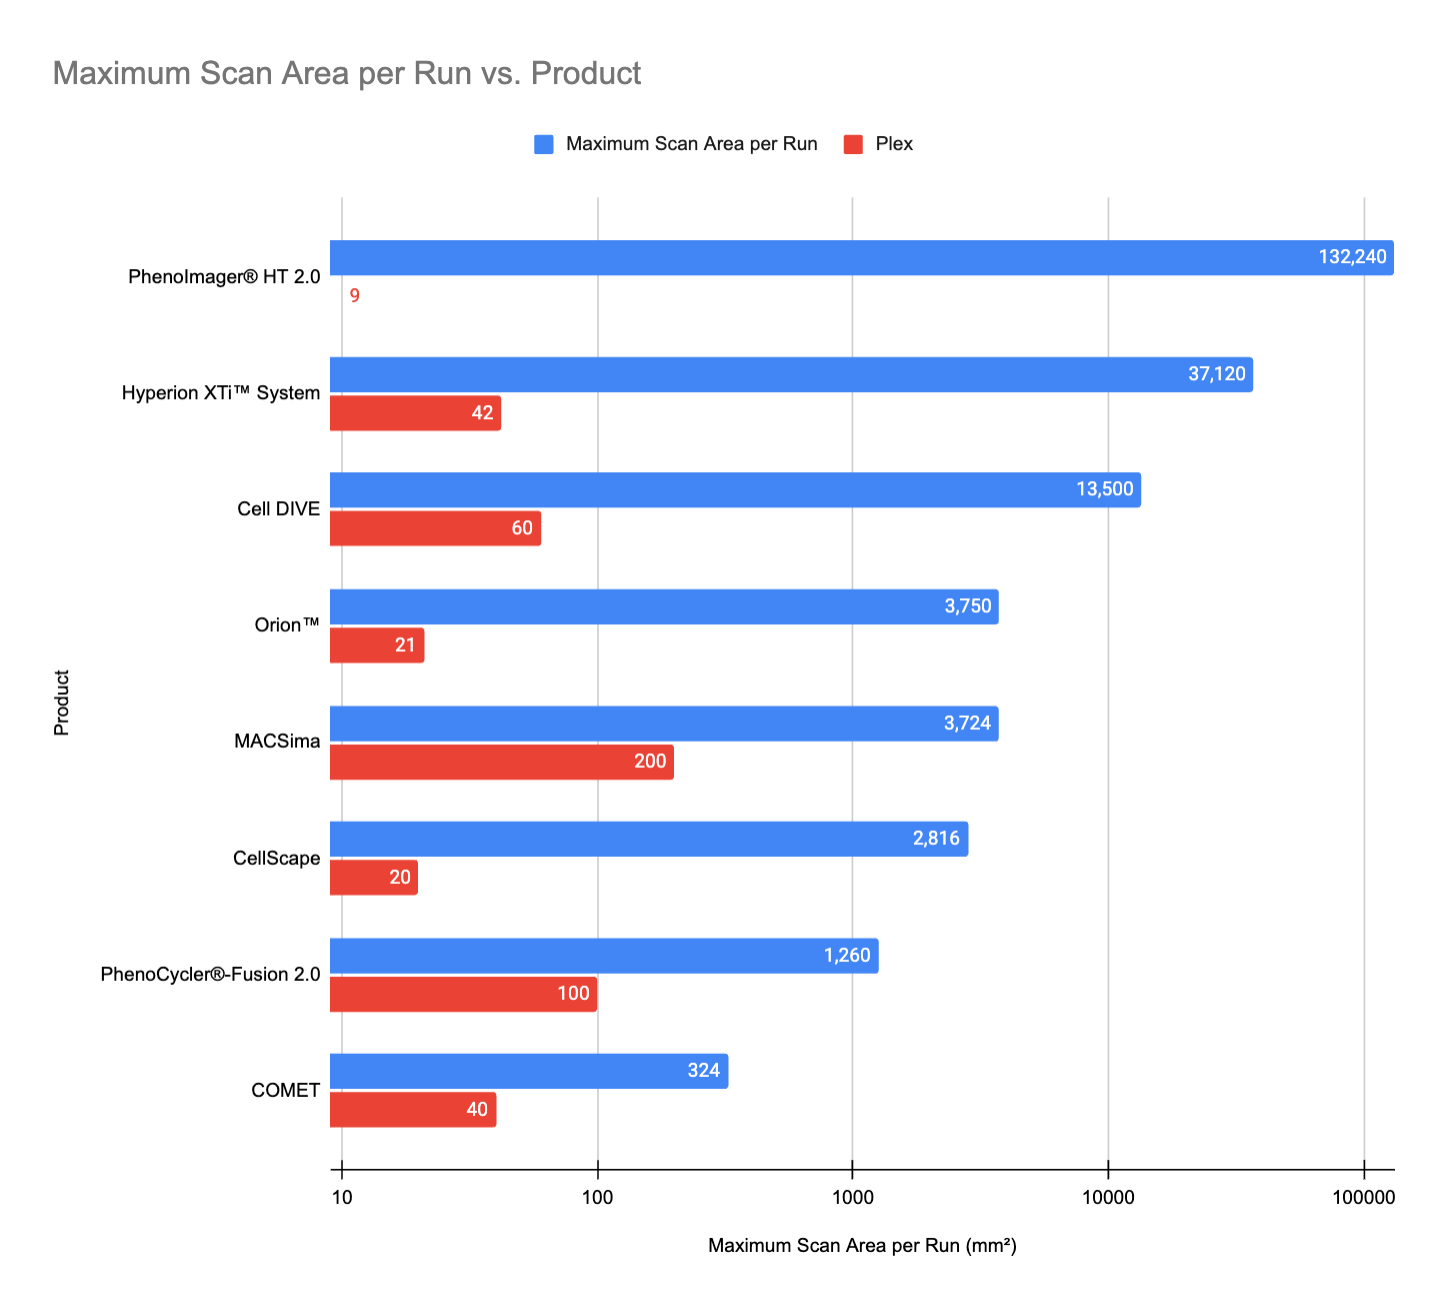
The PhenoImager® HT 2.0 by Akoya Biosciences leads in maximum scan area per run, reaching 132,240 mm². This is due to its large scan area per slide (ranging from 15 mm x 15 mm to 29 mm x 57 mm) and its high-throughput capacity, supporting up to 80 slides per run with continuous loading technology for low-plex panels.
Following this, the Hyperion XTi™ System reaches 37,120 mm², balancing medium-plex analysis (42 markers) with high-throughput capabilities when paired with its optional slide loader. Cell DIVE, from Leica Microsystems, comes in third with 13,500 mm², particularly when integrated with the BioAssemblyBot 200 from Advanced Solutions Life Sciences, which enhances its automation and scanning efficiency.
Other platforms, such as Orion™, MACSima, and PhenoCycler®-Fusion 2.0, offer smaller scan areas but provide higher plex options, indicating a trade-off between scan coverage and marker depth.
Cost
Initial capital equipment investment:
-
High-end systems ($500,000-$1,000,000+): Mass spectrometry-based platforms like Imaging Mass Cytometry (IMC) and Multiplexed Ion Beam Imaging (MIBI) represent the highest initial investments, requiring specialized instrumentation and dedicated facility space. These systems are typically found in well-funded research institutions and pharmaceutical companies.
-
Mid-range systems ($250,000-$500,000): High-plex fluorescence imaging technologies such as advanced cyclic immunofluorescence platforms fall into this category, offering a balance between multiplexing capability and cost.
-
Entry-level systems ($100,000-$250,000): Lower-plex imaging systems and attachments to existing microscopy platforms provide more accessible entry points for spatial proteomics.
Consumables and operational cost:
The per-sample expenses follow a consistent pattern across platforms:
-
Low-plex approaches (5-10 markers): $50-200 per sample
-
Medium-plex approaches (20-60 markers): $200-800 per sample
-
High-plex approaches (100+ markers): $800-2,000+ per sample
Service-based alternatives:
Many institutions provide spatial proteomics as a service model, offering a more cost-effective approach for groups with limited access to capital funding or specialized expertise. Core facilities typically charge: (1) base fee per sample type/preparation, (2) per-marker fees that increase with multiplexing level, and (3) addditional fees for custom antibody conjugation, validation, and advanced analysis
The potential hidden costs of antibody validation
Antibody validation often consumes unexpected time and budget in spatial proteomics projects. Panel development becomes progressively complex with each additional marker due to challenges in antibody compatibility, cross-reactivity, and epitope stability. The process involves costly steps including:
-
Sourcing appropriate antibodies (1-4 weeks)
-
Individual validation in specific tissue contexts (3-6 weeks per tissue type)
-
Technology-specific optimization, as antibodies validated for traditional IHC often perform differently on spatial platforms
-
For cyclic methods, confirming stability across multiple staining-imaging-stripping cycles
-
Iterative panel adjustments when changing one antibody affects others' performance
Pre-validated commercial panels can significantly reduce timelines but may be inadequate for novel tissue types, non-human organisms, or emerging disease biomarkers, often necessitating custom panel development that incur additional costs.
Multiomic Capabilities
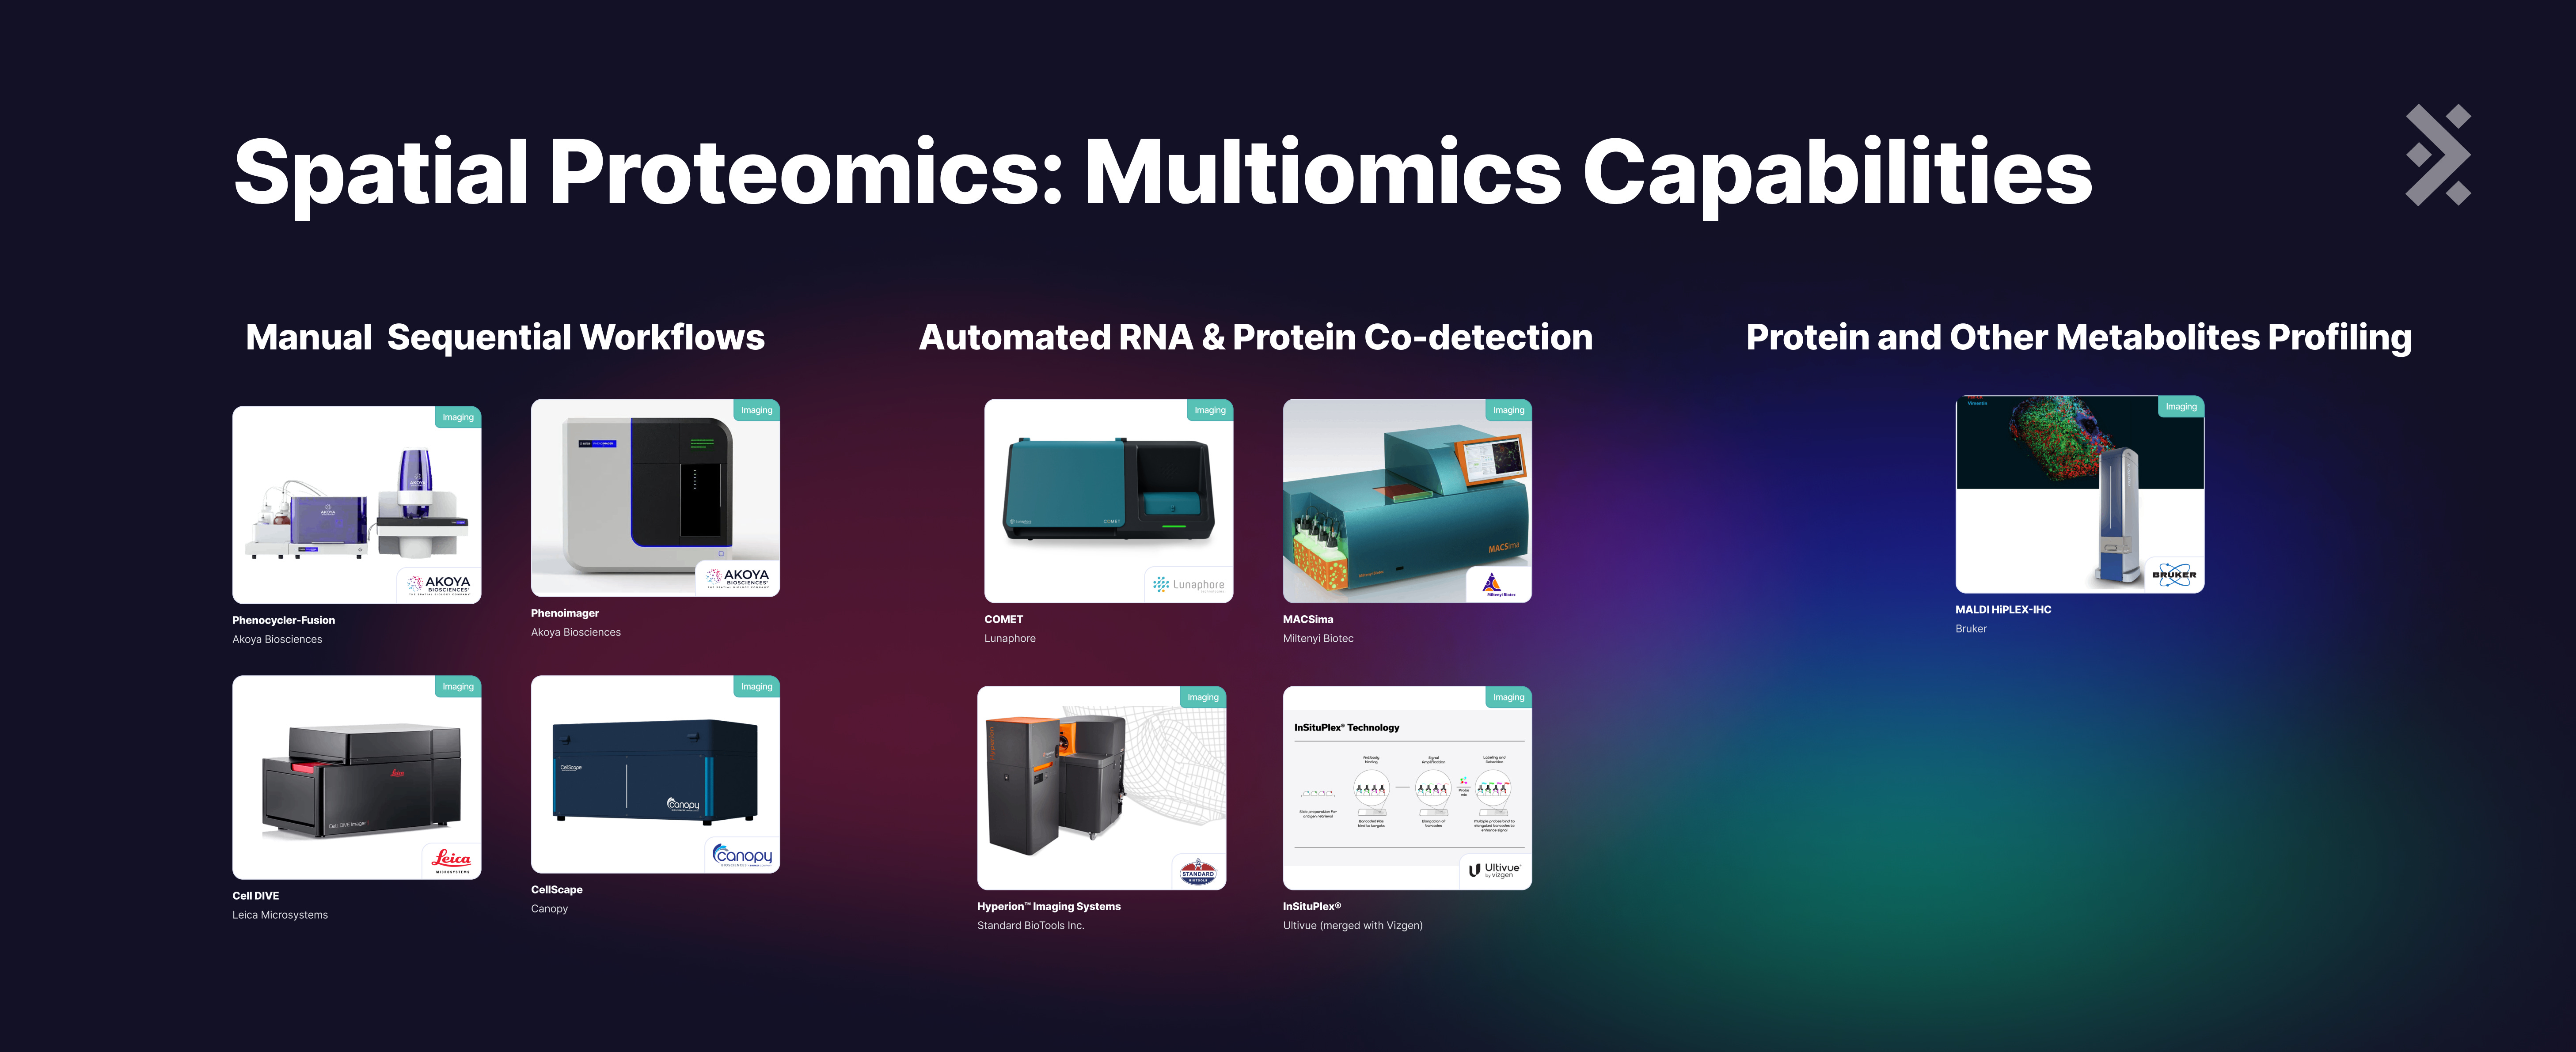
Many platforms enable RNA detection through manual sequential workflows. The PhenoCycler®-Fusion 2.0 and PhenoImager® HT 2.0 preserve sample integrity, allowing subsequent H&E, IHC, or in situ RNA analysis. Bruker's CellScape employs EpicIF technology with white light to gently remove signals while maintaining epitope and tissue integrity, enabling downstream IF, RNA-ISH, and proximity ligation assays. Similarly, Cell DIVE's dye inactivation process leaves samples undamaged, permitting additional downstream applications.
Other platforms allow for automated RNA and protein co-detection on the same slide, which can decrease workflow length. For example, COMET, Hyperion XTi™ System, and InSituPlex all allow for co-detection of up to 12 RNAs when combined with ACD Bio-techne RNAScope® assays. MACSima is able to provide up to 27 RNAs during protein co-detection via a multi-layered workflow combining its proprietary MICS (protein detection) and RNAsky™ (RNA detection) technologies. First, for RNA detection, it uses padlock probes that hybridize directly to mRNA targets without cDNA synthesis, and amplifies signals via rolling circle amplification (RCA), generating discrete fluorescent puncta. After detection, the RNA probes are washed away and cyclic protein staining with fluorescent antibodies begins, enabling detection of up to 200+ protein markers.
While some platforms emphasize RNA detection, others focus on broader molecular profiling. MALDI HiPLEX-IHC and MALDI GUIDED SPATIALOMX®, for example, prioritize the detection of metabolites, lipids, proteins, glycans, and xenobiotics rather than RNA.
Future Perspectives
Spatial proteomics has transformed our understanding of protein biology by preserving the critical spatial context within intact tissues, revealing intricate protein-protein interactions and cellular neighborhoods impossible to detect with traditional methods. This review explores the three main technological branches that have evolved to address this challenge: fluorescence imaging-based methods that overcome spectral limitations through clever multiplexing strategies; sequencing-based approaches that translate protein identity into DNA barcodes for high-throughput readout; and mass spectrometry techniques that provide either label-free discovery or metal-tagged targeted analysis. The commercial landscape now offers solutions ranging from low-plex, high-throughput systems ideal for clinical translation to ultra-high-plex discovery platforms detecting over 100 protein markers simultaneously. What does the future of the field hold?
Increasing Number of Targets
We’re entering the era of ultra-high plexity. What used to be cutting-edge, 30 or 40 markers, is now just the baseline. Single-cell deep visual proteomics (scDVP), pioneered by Rosenberger et al., shattered expectations by identifying 2,769 proteins from a single cell. On the commercial side, Bruker announced a 1,000-plex upgrade to its GeoMx platform, marking one of the highest levels of tissue proteomics to date. Similarly, Element Biosciences introduced new capabilities to the AVITI24 system, offering users flexible protein customization with up to 88 proteins per assay using pre-designed or user-defined probes. These developments signal a shift toward deep profiling at scale, enabling both discovery-driven and targeted studies.
From Imaging to Sequencing
The spatial proteomics field is expanding beyond fluorescence and mass spec–based imaging to include sequencing-based readouts. These methods leverage barcoded antibodies to convert protein identity into DNA, enabling NGS-based quantification at high multiplexity without spectral constraints. Notably, STOmics’ Stereo-CITE Proteo-Transcriptomics Solution is currently the only commercial platform offering unbiased co-detection of whole transcriptome and hundreds of proteins on the same tissue section, at single-cell resolution. Another notable example is Molecular Pixelation, developed by Pixelgen. MPX uses DNA-barcoded antibodies and a novel “pixelation” chemistry to capture both protein abundance and spatial arrangement on the surface of single cells — all without imaging. In MPX, cells are stained with oligo-conjugated antibodies, then treated with synthetic DNA "pixels" that bind locally, creating nanoscale spatial maps of protein distributions. These are then sequenced, generating high-resolution data on protein localization, polarity, and co-localization across thousands of single cells per run.
Reference Atlases
The field isn’t just generating data — It’s building reference blueprints for human biology. Bruker Spatial Biology, in partnership with Weill Cornell Medicine, is expanding the Spatial Atlas of Human Anatomy (SAHA) initiative, a major effort to map 30 non-diseased organs across multicellular, single-cell, and subcellular levels in a diverse adult population. These high-resolution atlases will be made publicly available, supporting cross-institutional benchmarking and biological discovery.
Software
As spatial data grows in both dimensionality and scale, software becomes the linchpin for extracting biological meaning. Platforms differ widely in their computational maturity: commercial systems often provide integrated pipelines for cell segmentation, phenotyping, and neighborhood analysis, while academic tools (e.g., Squidpy, Giotto, Napari plugins) offer flexibility but require coding expertise. Critical software differentiators include:
-
Cell segmentation accuracy (e.g., AI-assisted segmentation vs. classical watershed)
-
Spatial statistics support and visualization (e.g., colocalization, spatial correlation of differential expressed genes)
-
Multiomic integration tools (RNA + protein)
-
Scalability
As public spatial reference atlases become more available, we expect software interoperability and standard formats (like OME-TIFF, AnnData) to be key enablers of cross-study integration and meta-analysis. Ultimately, the platforms that combine flexible assay design with scalable, interpretable software will become the backbone of translational spatial biology.
We're excited to see how the field evolves. Maybe one day we will be able to see the entire proteome of every single cell, at every single location of the human body.