We have learned over the past decade that sequencing RNA and DNA is not enough to develop drugs or understand basic biology. Epigenetic modifications are implicated in widespread and uncured diseases, like dry AMD and breast cancer, and drive core biological processes like cell fate commitment.
There are many experimental techniques that help scientists understand the epigenome, but ATAC-seq is likely the most widespread. However, making sense of this data is difficult, and running bioinformatics workflows is only a small piece of the full analysis lifecycle. The main goals are to locate peaks of chromatin accessibility across the genome, decide if they are biologically meaningful and examine how they change with covariates like drug treatment or tissue type.
This task is highly interactive, but also manipulates a lot of data. It requires software that allows scientists to perform genome-scale operations and render peaks across multiple samples with low latency. To accomplish this, we showcase a suite of tools scientists use to interrogate ATAC-seq data, and outline how they fit into a broader data infrastructure suitable for interdisciplinary collaboration and long term data re-use.
Unlike previous lifecycle posts on qPCR and bulk RNA-seq, we will start with the end reports, and work backwards to the sequencer, to answer concrete biological questions:
-
How do peaks of accessible DNA vary between different samples?
-
Are there enriched motifs or functional annotations associated with these regions?
-
Where are genomic regions of chromatin accessibility?
Interactive Dashboards for Scientists
Plots allows data scientists or computational biologists to build dashboards in Python, while exposing no-code controls to scientists. To handle the genome scale operations necessary for ATAC-seq analysis, each dashboard cell can dispatch code and data to large computers.
We have released a layout with user-tested visualizations for common ATAC-seq tasks that can be the basis for extension or modification.
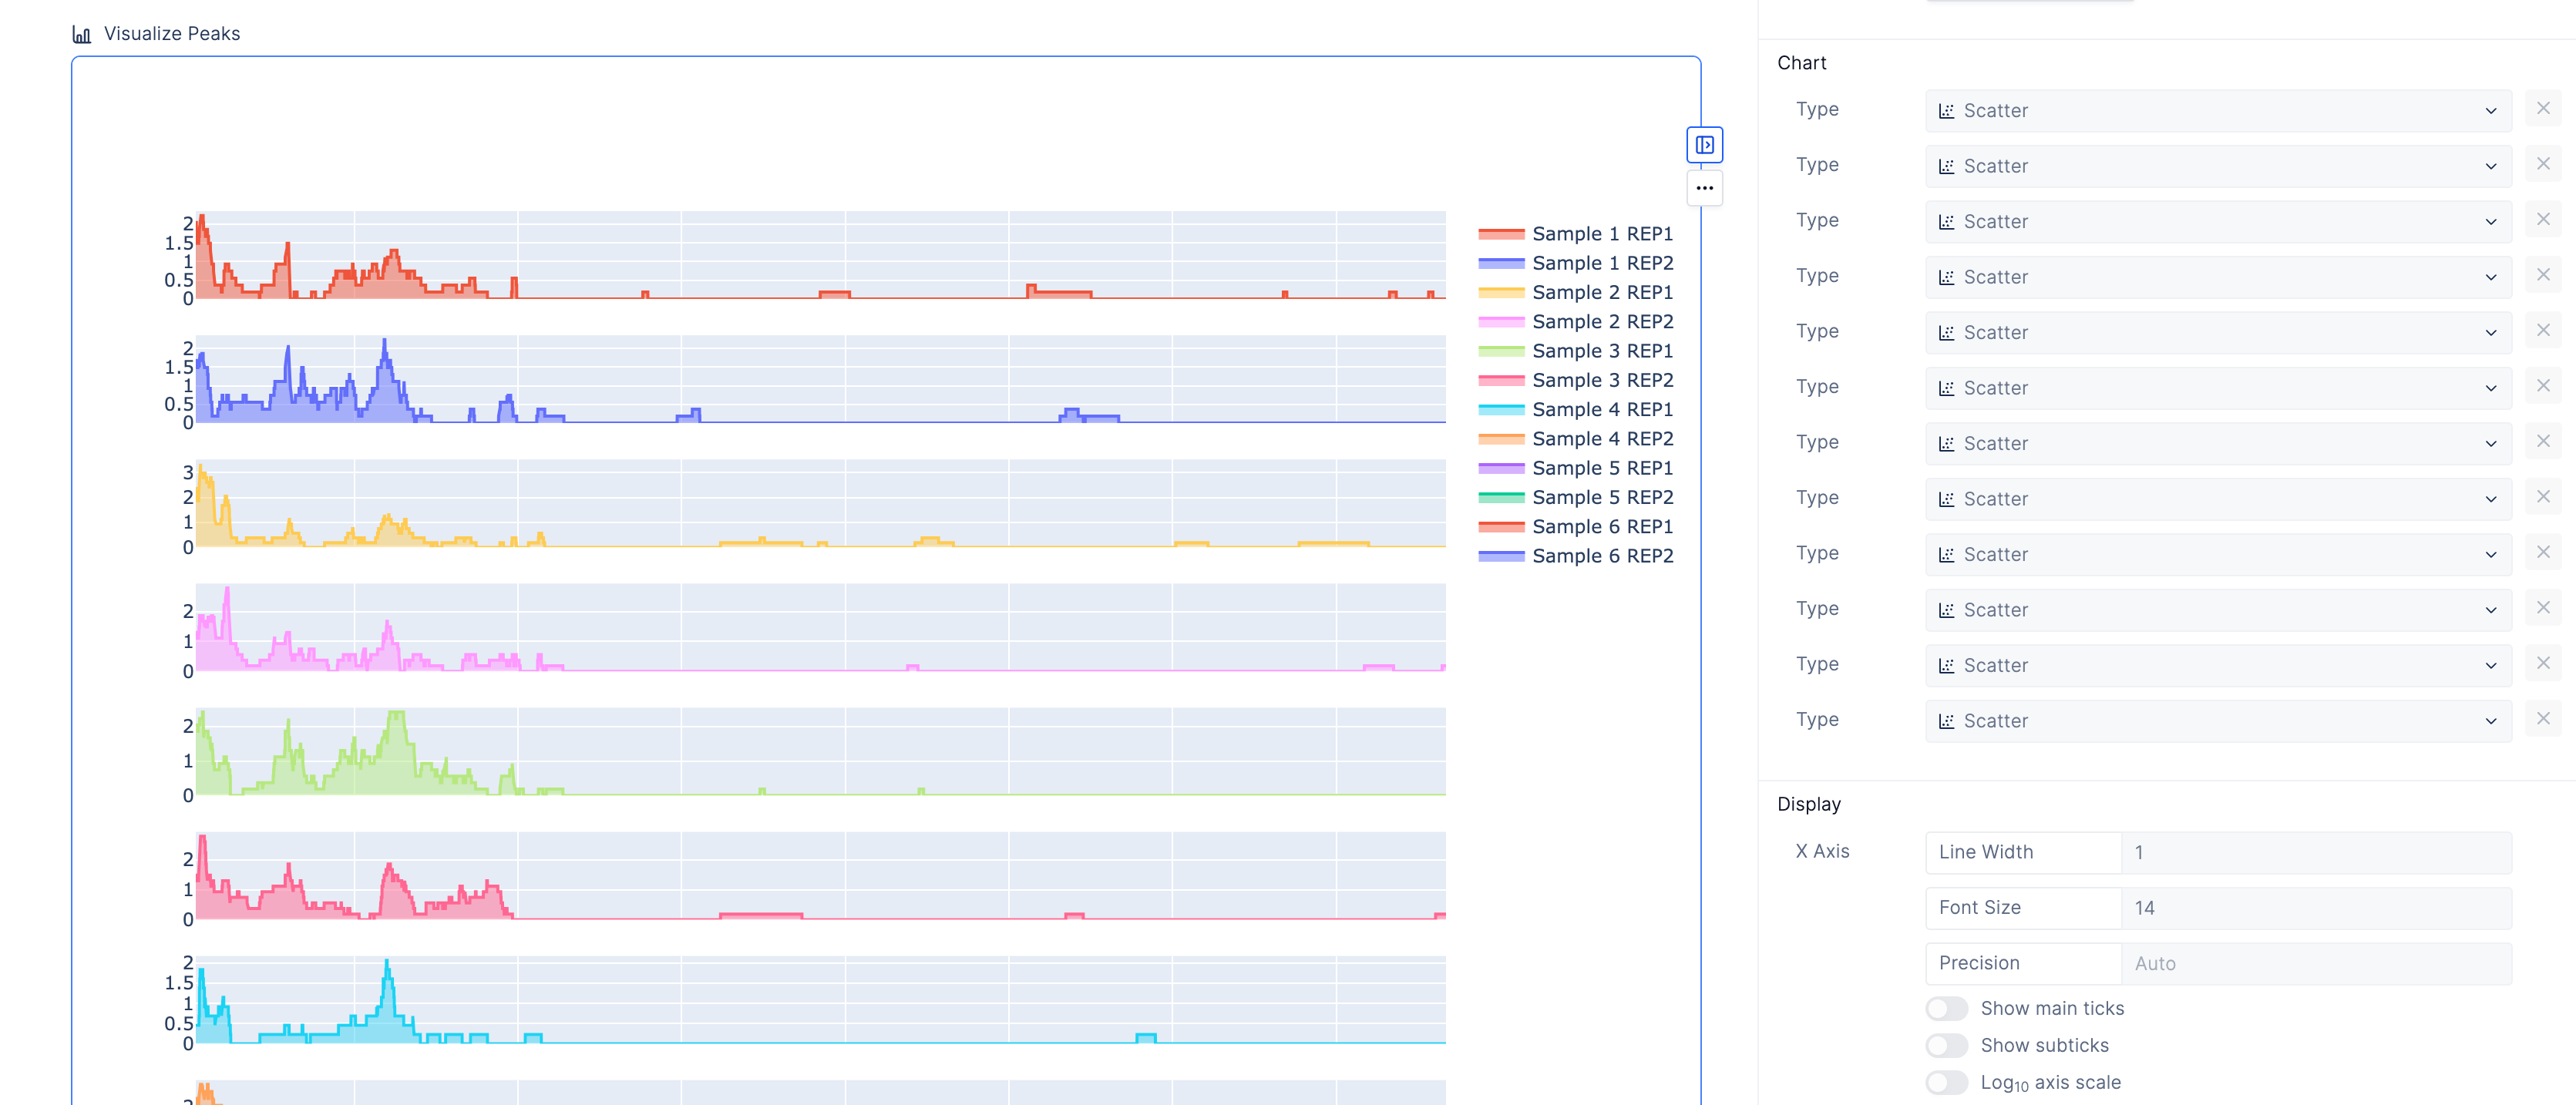
Compare peaks across samples
The peaks are the most important part of the analysis. Scientists have relied upon IGV to identify these segments of interest, but we also provide an interactive peak visualization dashboard with more control over the formatting for publications or slides.

Scientists can search for genomic intervals by chromosome or gene.

Quality Control
A array of QC plots are available to sanity check data. Read more about the motivation and practical use of these figures in the user wiki.
Distribution of fragment length

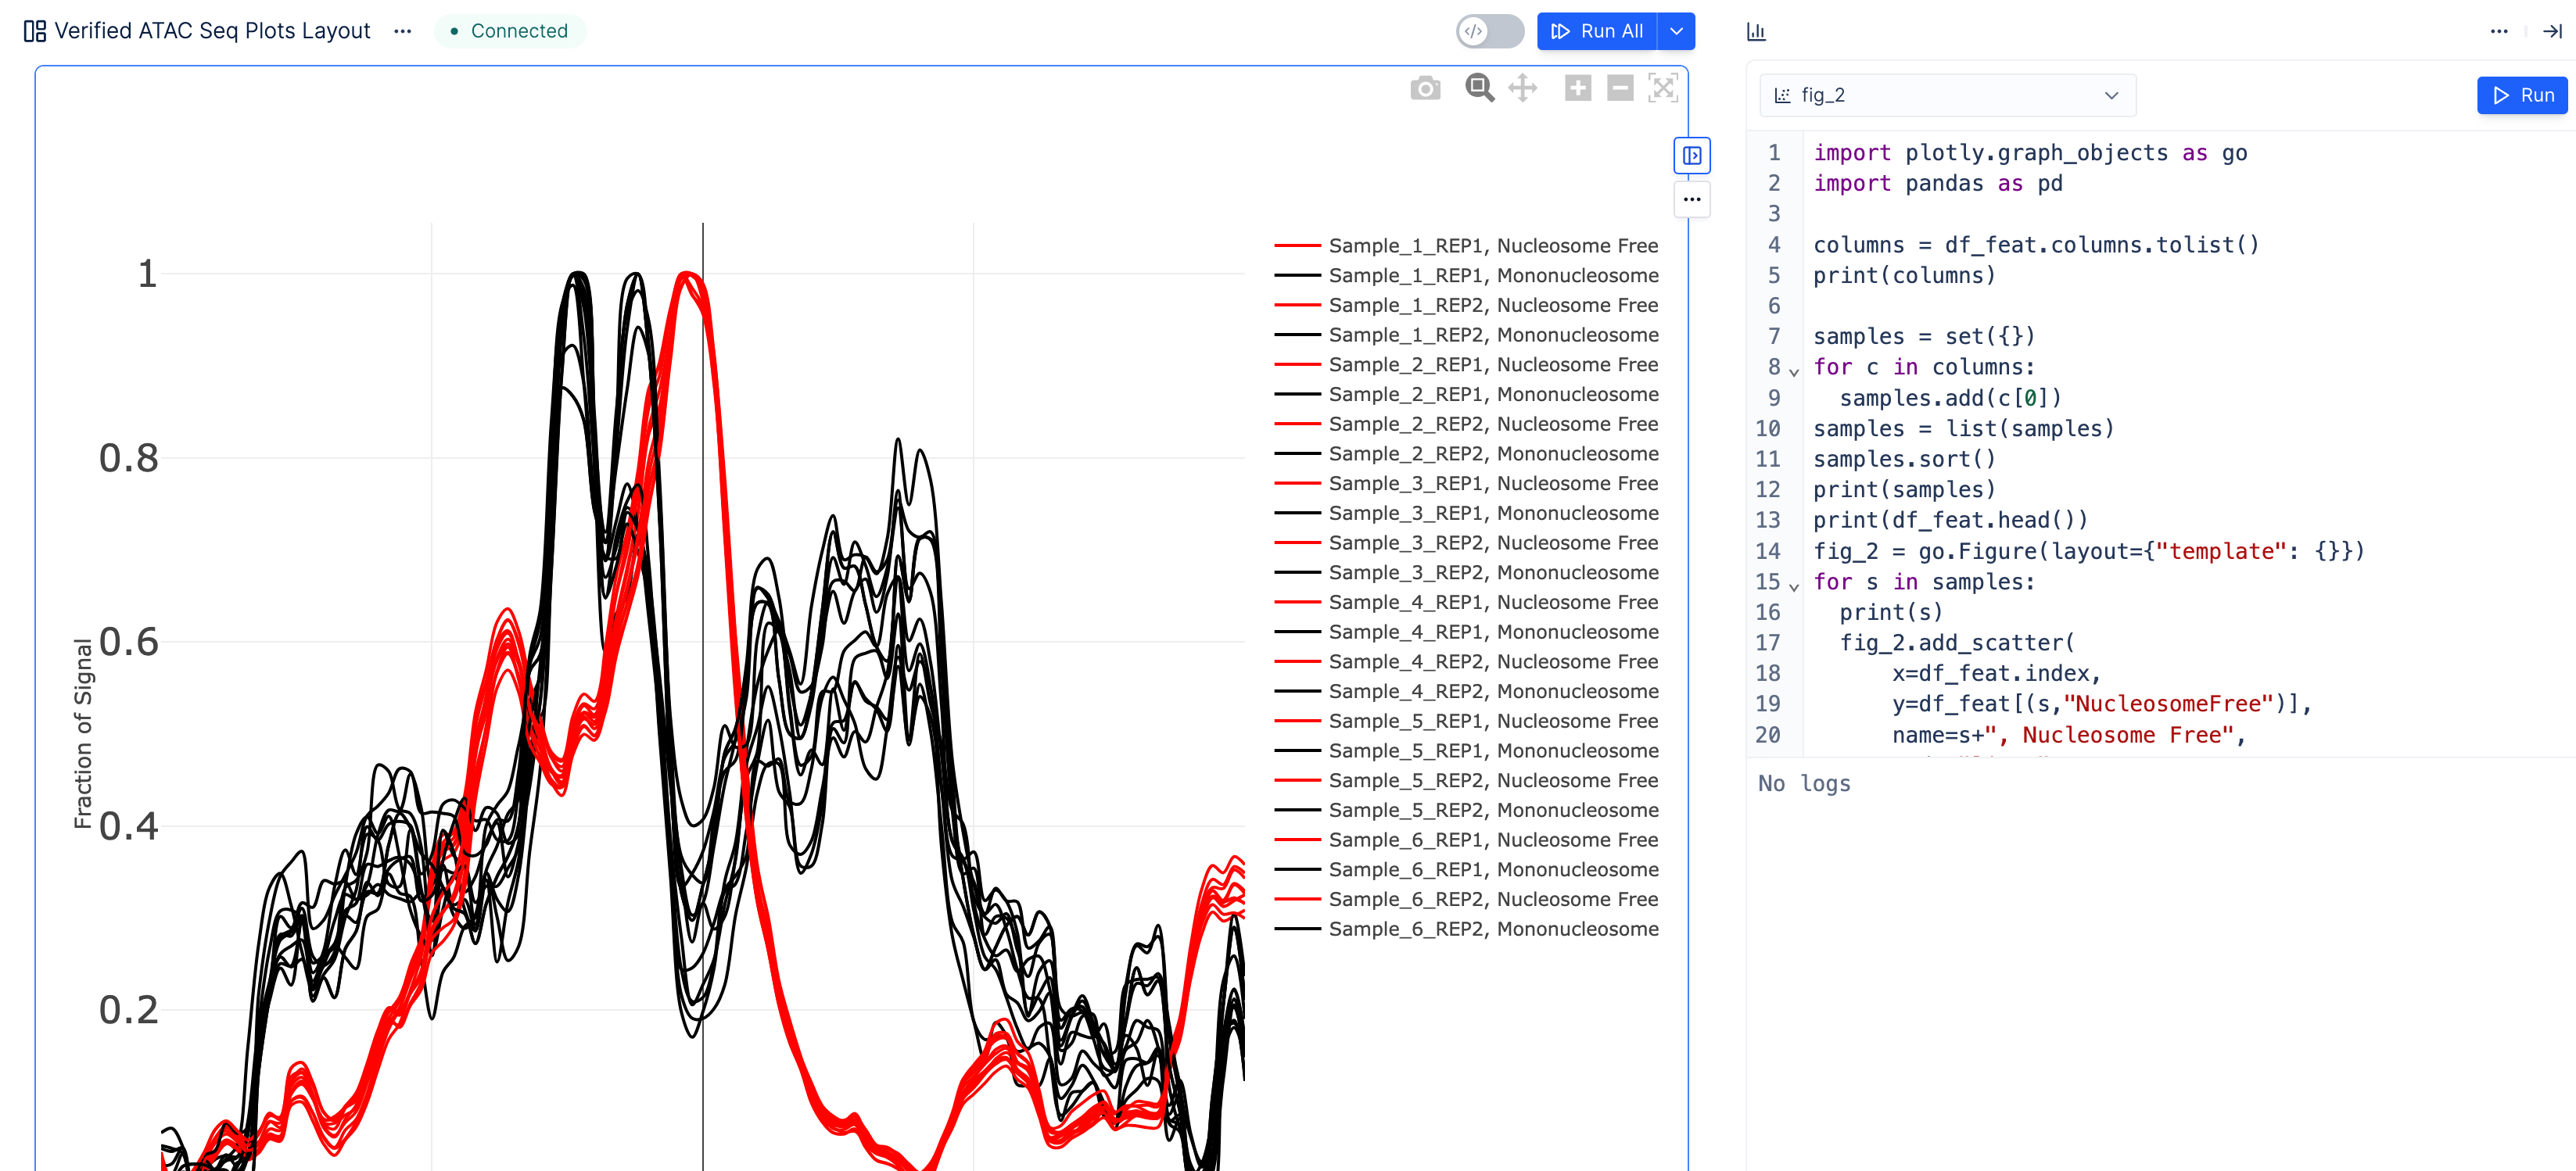
Fraction of coverage signal around Transcription Start Sites (TSS). Here we also highlight the ability to generate plotly from Python, in addition to the no-code controls.
Differential accessibility analysis (PCA Distance Matrix)

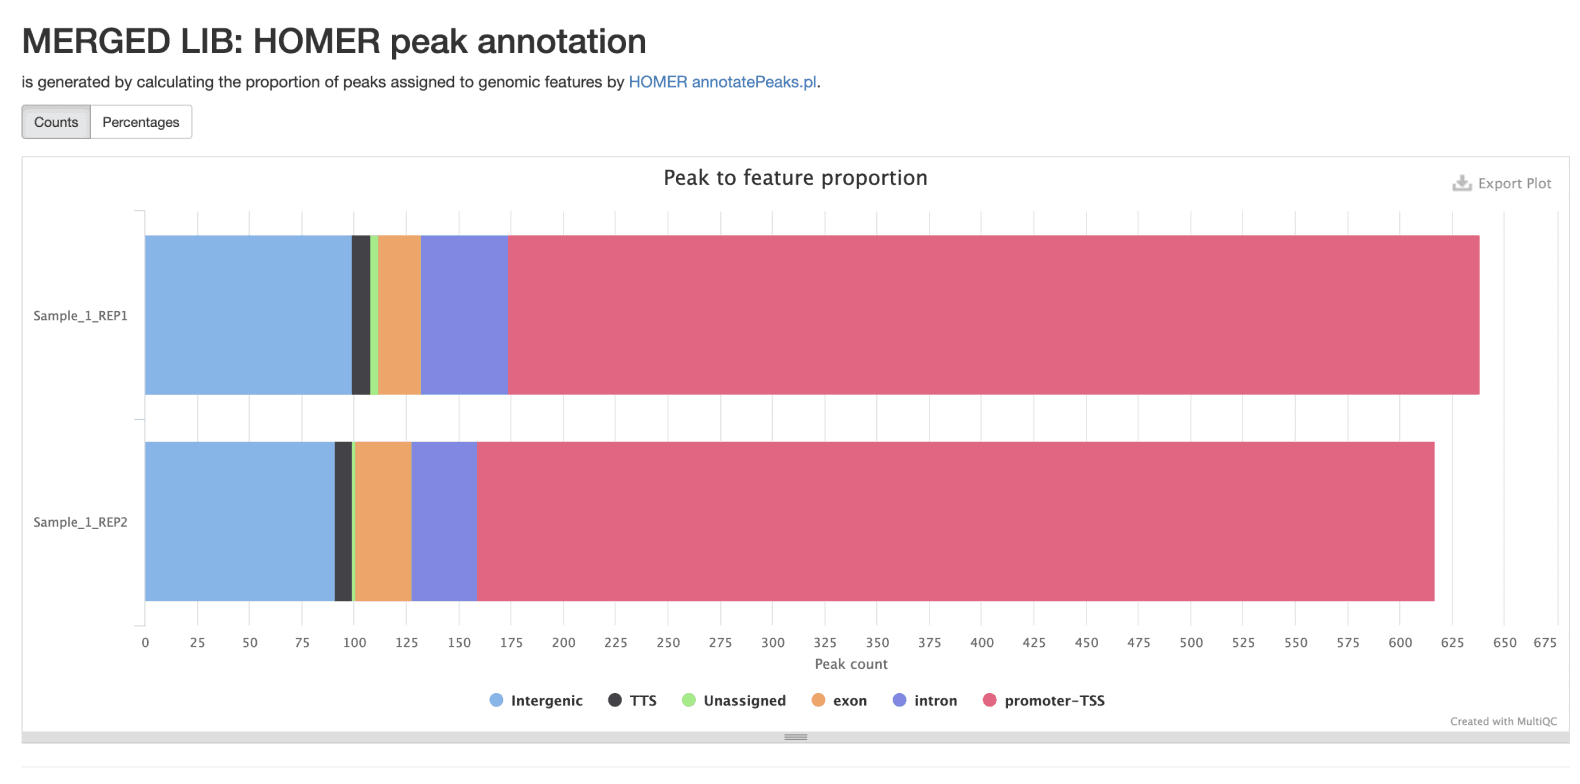
Annotate Peaks with Function Using Homer
Supplementing peaks of interest with information about function from other studies provides additional substrate for hypothesis building or future experiments. Here HOMER annotates genomics coordinates with these annotations.
Explore Peak Tracks with IGV
Scientists spend a lot of time simply exploring peak tracks in genome browsers, without a specific goal in mind, to tease out interesting structures and locations.
However, these browsers, like IGV, can be difficult to install and get working with large sequencing files, and often require specific indexing or other pre-processing steps that demand basic coding ability.
Latch allows scientists to double-click on track files and view them in IGV without this setup.
Align Reads and Call Peaks
nf-core/atacseq is an open-source bioinformatics workflow that processes raw sequencing reads, aligns them to genes and calls peaks. The pipeline uses gold-standard tools and is maintained by the growing nf-core community.

This workflow is hosted using a native Nextflow integration, with a graphical interface for accessible analysis by scientists. It can be modified or extended as needed with minimal modifications to existing Nextflow code.
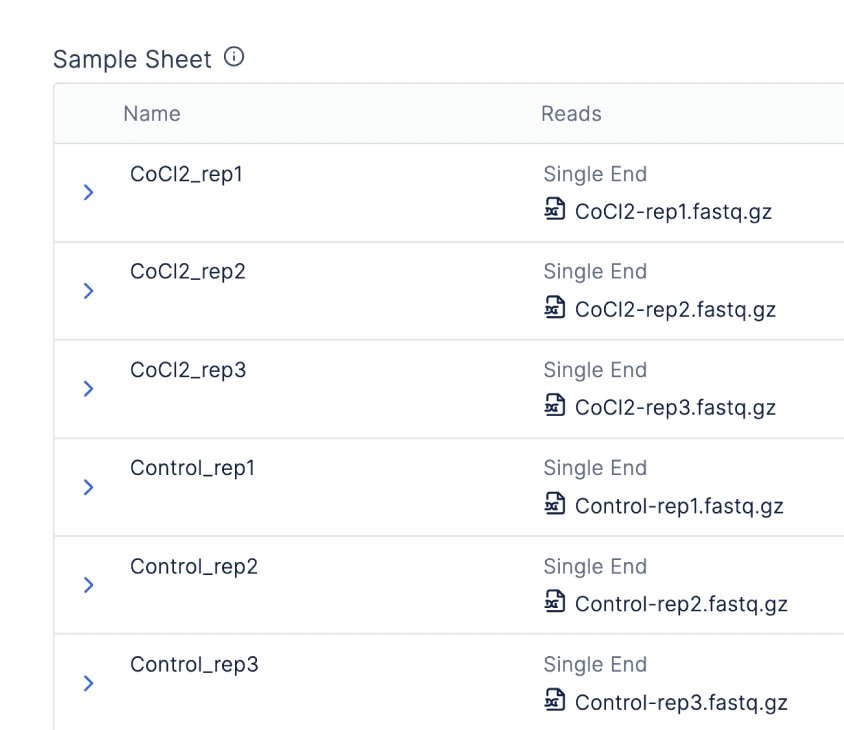
There is also an integration with Registry so batched workflows can be launched from “graphical sample sheets” or tables associating raw sequencing files with metadata.

When bulk importing sequencing files from Registry tables, scientists can take advantage of quality-of-life features, like the automatic parsing of paired end files or sensible handling of replicates.
Capture Experimental Metadata
Structuring raw sequencing outputs with necessary metadata from the wet lab is necessary for flexible downstream analysis and data re-use long into the future.
Registry allows platform teams to create typed and error-validated schemas to model their ATAC-seq experiments. This allows bench scientists to provide information about their experimental design, such as cell line, drug dose and growing conditions, in a graphical interface. The schemas link this metadata directly to both raw sequencing files and processed results, like peaks, functional annotations and the plot layouts described above.
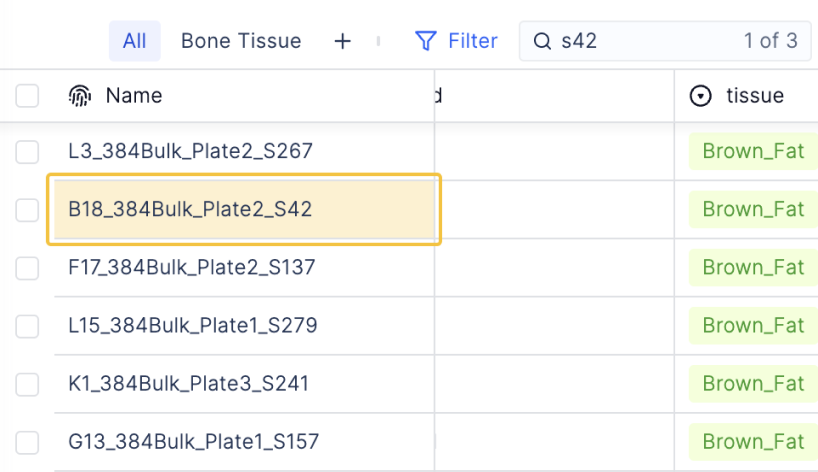
Typed column values, and graphical error validation, preserve a consistent structure for future exploratory analysis.
Store Sequencing Data
The analysis life cycle begins with a central storage location with direct links to upstream sources of sequencing data. Latch Data streams sequencing files from Illumina machines with a BaseSpace integration and allows AWS / GCP buckets to be mounted to a shared file system.
When FastQ files are uploaded, FastQC is automatically run, where a double-click will reveal a quality control report.

The long-term data storage system also provides provenance, providing a clear ledger of upload and download events for any file object, linking the user, bioinformatics workflow or data source when appropriate.
Install Latch for ATAC-seq
Latch is a modular and highly programmable data infrastructure designed to orchestrate wet and dry lab teams for deeper + faster biological consensus. For more information about the components of the platform, peruse our documentation:
We work with over 100 biotechs, ranging from fledgling startup to top 20 biopharma, and invest heavily in support and customer obsession. Our bioinformatics and engineering services team would love to partner with you on your next project. Book a Demo.
—