This past decade, we’ve seen the rise of dozens of spatial technologies capable of profiling millions of proteins and RNAs in their native tissue contexts.
Breakthroughs like Curio Bioscience’s Seeker and Trekker capture spatially-resolved whole transcriptomes by placing tissue sections on barcoded surfaces. Vizgen’s MERFISH uses sequential rounds of single-molecule fluorescence in situ hybridization with combinatorial labeling for each RNA species. NanoString’s CosMx Spatial Molecular Imager can detect 18,000 genes simultaneously at subcellular resolution.
The ability to construct complete spatial and temporal atlases of entire organs across disease states and developmental stages is finally attainable. But these new technologies bring a new scale and complexity of data. Individual experiments routinely produce terabyte datasets, combining high-resolution microscopy images, spatial coordinate mappings, and molecular count matrices.
Each platform outputs proprietary data structures and formats, with preprocessing and data wrangling before integration with open-source visualization tools. Existing viewers struggle with performant image and molecular scatterplot rendering, creating a frustrating user experience hardly conducive to free biological exploration. Beyond visualization, scientists must toggle between viewing data and conducting sophisticated analyses: differential gene expression, cell-type deconvolution, ligand-receptor analyses, and more.
Much like early genomics required genome browsers to contextualize high-throughput data, spatial biology now demands an analogous tool: one that supports dynamic, multi-modal and interactive visualization at the scale of millions of cells, all while plugging into a robust ecosystem of ready-to-use, open-source tools.
Here we introduce an H5 viewer for large spatial data built from new systems technologies and outline its design, function and practical use in real biological flows.
Design Principles
The H5 viewer is a widget in Latch Plots: a Python-based, reactive notebook purpose built for high-throughput biological data analyses.
from lplots.widgets.ann_data import w_ann_data

w_h5(ann_data=adata, spatial_dir="latch://117.account/some-data")
The widget takes two parameters: (1) an AnnData object and (2) a directory that contains multiple image layers – morphology, nuclear stains, H&E scans – and a DuckDB database of transcripts.
Each image layer is converted into a PMTile file: a pyramidal format of hierarchical image tiles originally built for rendering interactive maps. The format allows fast, random access to image chunks through HTTP range requests directly from blob storage. This allows smooth zooming, panning, and multi-layer visualization in the browser without a dedicated backend server.
Our team repurposed the technology to performantly stream chunks of high content spatial images to molecular viewers and wrote code to build these files directly from the outputs of popular spatial vendors, like CosMx, Singular and Xenium.
A DuckDB database file with transcript coordinates and metadata is stored in this same directory. DuckDB is a lightweight, in-memory database that allows direct access to large transcript data with a performant SQL engine.
The combination of AnnData, PMTiles and DuckDB allow the precise and low-latency overlay cell, transcript and image information in real time. Researchers can filter transcripts by gene name, region, expression level or cell type while rendering relevant sections of high resolution morphology.
A Bet on H5
While standards for spatial data storage are still fragmented, we are seeing convergence around the H5 file format. Originally developed for early high dimensional data from satellite imagery and particle colliders in the early 2000s, HDF5 (H5) first gained widespread adoption in biology when single cell techniques began producing abundant count matrices around 2010.
The H5AD format, a precise way of storing transcripts and metadata in an H5 file, was popularized by the AnnData project and continues to gain adoption with native Python libraries and abundant community driven best practices. As “higher order” molecular assays began supplementing transcript counts with new measurements – like images, proteins and epigenetic signatures – teams started storing this information in or around the core count matrix. With strong libraries, filesystem-like internals and community inertia, we’ve chosen to build our viewer around this format.
Adaptable to any Imaging and Sequencing Instrument
Because each spatial vendor generates different output files, our team wrote a Python library that constructs spatial AnnData objects, PMTiles files and DuckDB files directly from native instrument outputs. These files should “just work” with the H5 viewer.
The library supports widely used platforms, like Nanostring CosMx, 10X Genomics Xenium, Singular G4X, and Vizgen MERFISH. We are eager to work with new companies and expand the library to new technologies.
Features
Color by Categories or Genes of Interest
In the viewer, you can color by genes of interest or various categories in the observation layer of the AnnData object.
Lasso-select and annotate
Use the lasso selection tool to select clusters of cells and assign them a unique label. Any changes to the UI automatically mutate the underlying AnnData object so it can be used elsewhere in the analysis within the same notebook.
Image Alignment
Spatial technologies often capture brightfield or H&E images from the same slide or serial sections. The H5 viewer supports standard formats (TIFF, PNG, JPEG) and overlays them onto AnnData spatial embeddings using a landmark-based coordinate mapping system.
The viewer offers two alignment modes: affine alignment and STAlign.
Affine alignment applies a linear transformation matrix to account for translation, rotation, scaling, and shear. It requires at least three corresponding landmarks and uses least squares optimization to minimize residuals, making it well-suited for minimally deformed tissues.
In contrast, STAlign is designed for cases where tissue deformation occurs, such as with serial sections in Slide-seq, DBiT-seq, or Stereo-seq. It performs non-rigid registration by locally warping the image to match the spatial coordinates of the transcriptomic data, allowing for alignment even when the tissue is stretched, folded, or distorted.
While STAlign typically requires a multi-step setup (loading data into a Jupyter notebook, entering precise X and Y landmarks, tuning regularization parameters, and optionally using a GPU for acceleration), the H5 viewer abstracts all of this. Users can interactively define correspondences through the interface, and the alignment runs in the background, delivering robust registration without requiring any code.
Scale to millions of cells
The same enormous and multi-layered data that make spatial techniques so powerful also make visualization a challenging engineering problem. A CosMx machine can output 464K cells, 543M transcripts and multiple layers of high content images. In aggregate, the file data can approach 1TB for a single experiment on 100mm^2 of tissue. This volume will only increase as assay throughput continues to follow linear (and in some cases exponential) curves.
Moving large precise and large quantities of data from disk, over network and into a browser requires experience with storage devices, file systems and browser internals. A deep understanding of systems will be required to continue writing performant software as instrument throughput continues to climb. (We encourage engineers interested in these problems to reach out to the team)
Dispatch Compute Intensive Workflows
Visualizing the images and molecules is just the start of spatial analysis. The true scientific value comes from doing things with the data. Researchers need to toggle between visual inspection and spatial domain detection, neighborhood interaction mapping, or pseudo-bulk differential expression across tissue regions.
Interactive Analysis Suite
Latch Plots provides direct access to essential analytical tools from the H5 viewer, including quality control filtering, PCA/UMAP recomputation, Leiden clustering, and differential expression analysis. Unlike static visualization platforms, the Python for these interfaces can be accessed and extended in the browser. The “Edit” mode reveals the underlying Python code for every UI component and any data transformation.
This flexibility enables deep customization: Latch engineers have collaborated with technology providers to modify plot templates with platform-specific modules, creating tailored workflows for distinct spatial biology technologies.
Compute-Image Integration
Advanced spatial analyses require tight coupling between tissue visualization and resource intensive tools. Ligand-receptor interaction analysis must toggle between spatial regions of interest and long workflows. Similarly, cell type deconvolution can take over a day on complex datasets and require some interaction with a workflow orchestrator.
Researchers use lasso selection tools within the H5 viewer to define cellular populations or spatial regions, then trigger compute-intensive analyses with a single “Launch” button. These workflows are defined via Latch’s Python, Nextflow, or Snakemake SDKs, providing users with real-time progress monitoring and complete execution logs. Upon completion, results are automatically integrated back into the Plots environment for immediate visualization and downstream analysis.
Scalable Ecosystem
Currently, Latch supports over 12 downstream analysis modules, opening the gateway to a robust infrastructure and ecosystem of ready-to-use, open-source tools.
Real Flows
The best way to understand a tool is to understand how it tackles real tasks. We’ll show the H5 viewer in action with a handful of realistic biological flows.
Takara Bio Seeker and Trekker: Spatial Temporal Atlas of Mouse Ovaries
Ovulation is essential for reproductive success, yet the underlying cellular and molecular mechanisms are far from clear. We reproduced a study from Mantri et. al (2024), which used Takara Bio’s Seeker technology to build a detailed, time-resolved atlas of mouse ovarian follicle maturation and ovulation.
Data Acquisition and Processing
First, raw FastQ files can be downloaded from GEO, along with Hematoxylin and Eosin (H&E)-stained images of tissue sections from mouse ovaries at seven distinct stages, spanning from preantral to post-hCG-triggered preovulatory phases.
Using Seeker’s hosted bioinformatics pipeline on the Latch Platform, FastQ files can be processed into multiple H5AD objects, one per sample. The Seeker pipeline on Latch also pre-computed the UMAP, ran SCTransform for normalization, and found spatially variable genes. All preliminary results are organized into a user-friendly HTML file that can be opened directly on Latch Data.
Sample Integration and Visualization
A dedicated workflow merged all per-sample H5AD files into a unified object, introducing spatial offsets, which enabled side-by-side sample visualization in the H5 viewer. This integration facilitated comparative analysis across developmental stages.
Quality Control and Analysis Pipeline in Plots
Users can then open a Latch Plots notebook, where they can ingest the H5AD object and open it in the H5 viewer. In the same notebook, we performed quality control (QC), filtering, identified highly variable and spatially variable genes, and applied Leiden clustering.
Spatial Segmentation and Image Alignment
Spatial data analysis requires precise segmentation of tissue regions based on morphological features. We examined spatial embeddings for individual samples, uploading corresponding H&E images to the H5 viewer for detailed examination. The viewer’s interface provided intuitive controls for image manipulation, including rotation, zoom, pan, and flip functions.
A unique aspect of Seeker technology involves capturing H&E images from serial tissue sections rather than identical slides. This approach introduces alignment challenges, as tissue sections may exhibit distortions, shearing effects, and imperfect overlap that cannot be resolved through simple affine transformation methods.
To overcome these limitations, H5 viewer comes with an interactive anchor point assignment system and STAlign, a GPU-accelerated alignment tool. STAlign addresses the complexities of partially matched tissue sections and local non-linear distortions through diffeomorphic metric mapping, providing robust alignment solutions for challenging tissue geometries.
Follicle Identification and Downstream Analysis
Using aligned images as reference, we lasso selected and labeled follicles within each sample. These follicle regions serve as pseudo-replicates for subsequent pseudo-bulk analyses using the DESeq2 pipeline on Latch, enabling the identification of distinctive gene expression signatures across different cell types throughout follicular development.
Cell Type Deconvolution and Ligand-Receptor Analyses
Each 10-micron Seeker bead captures transcripts from approximately 1–2 cells, making cell type deconvolution necessary. In Latch Plots, the transcriptomic H5AD can be saved to Latch Data and processed using the cell2location workflow.
The resulting annotated H5AD file can then be reloaded into Plots and visualized in the H5 viewer to inspect predicted cell types.
Once we were confident in cell-type assignments, we performed ligand-receptor analysis. Squidpy’s ligand-receptor module is usually computationally intensive due to the large number of spatial permutations it evaluates. To optimize performance and relevance, we utilized the lasso-selection tool in the H5 viewer to define specific regions of interest. This focuses the analysis on cell-cell interactions that are spatially proximal, filtering out biologically implausible long-range interactions.
AtlasXOmics: Spatial Epigenomics Analysis
Epigenetic profiling assays are essential for understanding gene regulation, but traditional approaches lack spatial context. Spatial epigenomics reveals how chromatin modifications distribute across native tissue architecture, illuminating the geometric relationships between regulatory states and disease biology.
AtlasXOmics developed deterministic barcoding in tissue sequencing (DBiT-seq), the first platform enabling spatially-resolved epigenome profiling. Using microfluidic chips to deliver barcodes to precise tissue coordinates, DBiT-seq extends single-cell ATAC-seq and CUT&Tag assays to spatial contexts, uncovering causative relationships between chromatin accessibility, histone modifications, and context-specific gene expression within intact tissues.
However, synthesizing tissue morphology with epigenetic state relies on techniques in image processing and sequencing bioinformatics that make data analysis challenging.
Data Processing
ATAC-seq generates a large files of barcoded sequencing reads, each of which corresponds to a unique tranposase insertion event at the sequenced locus. These reads must be aligned to a reference genome, their barcodes error corrected, their adapters trimmed and aligned coordinates adjusted for known behavior of the transposase (Tn5-shift). The result is a fragment file, annotating sequenced fragments with genomic coordinates and error corrected barcodes.
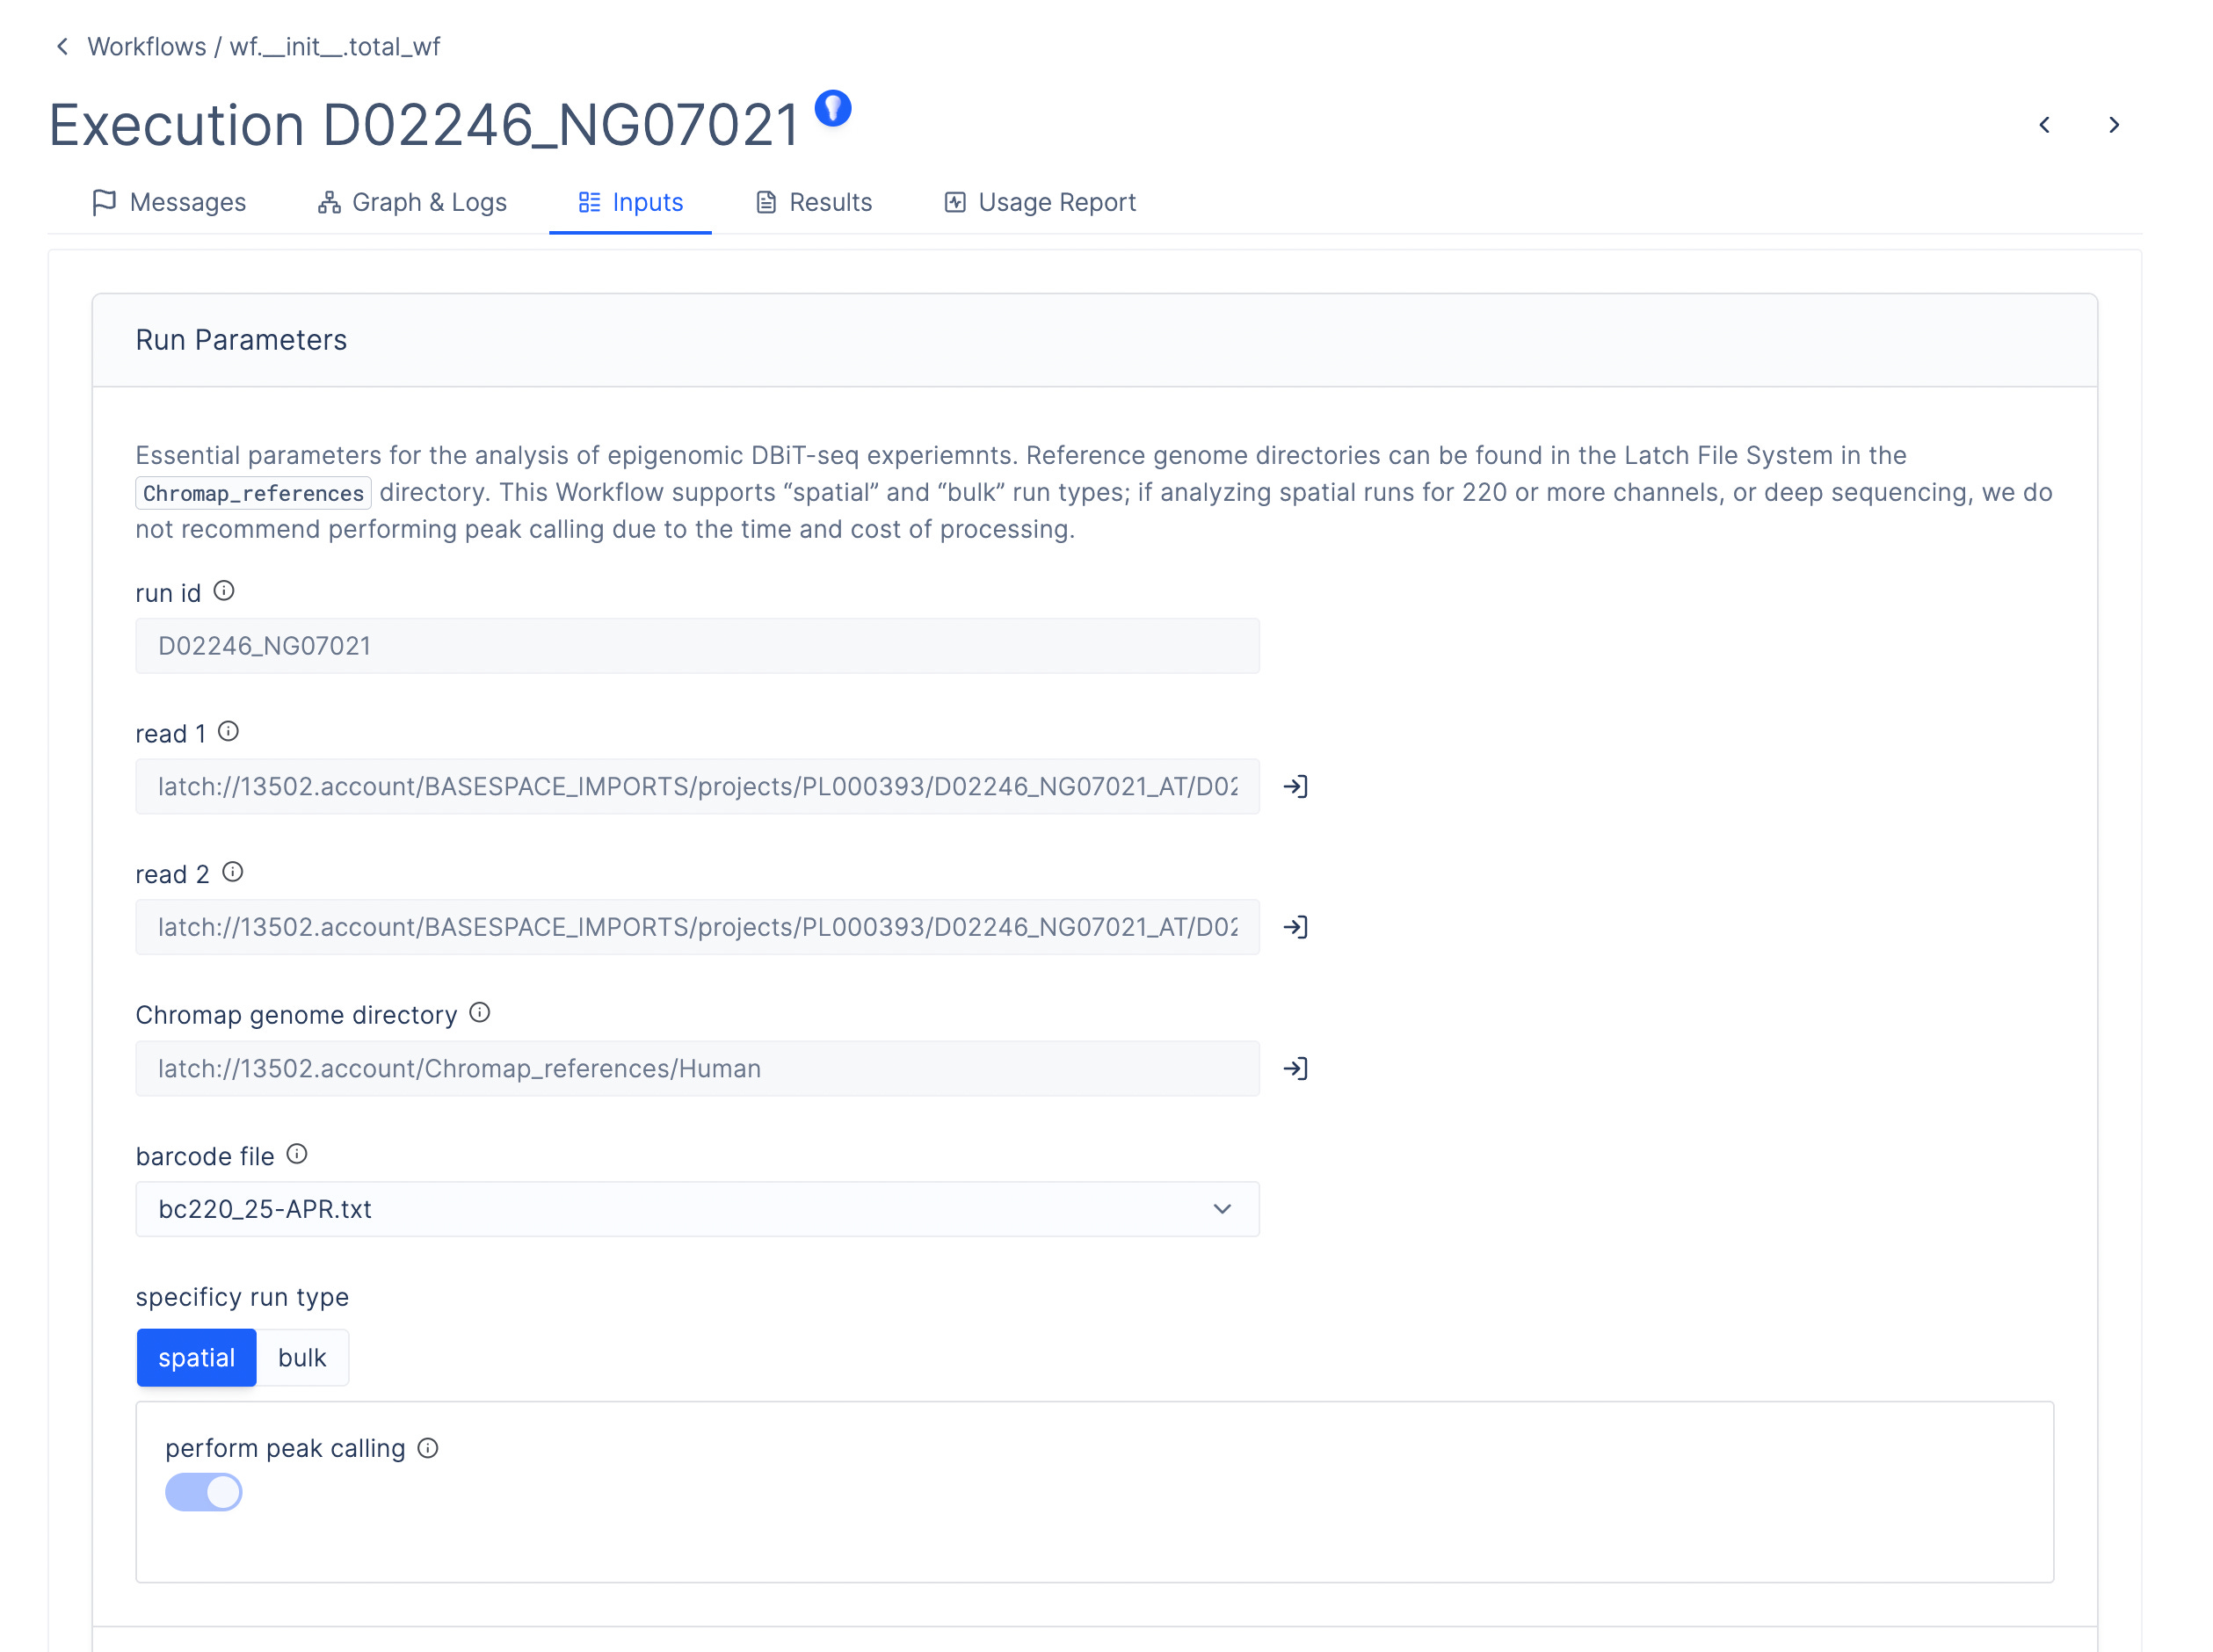
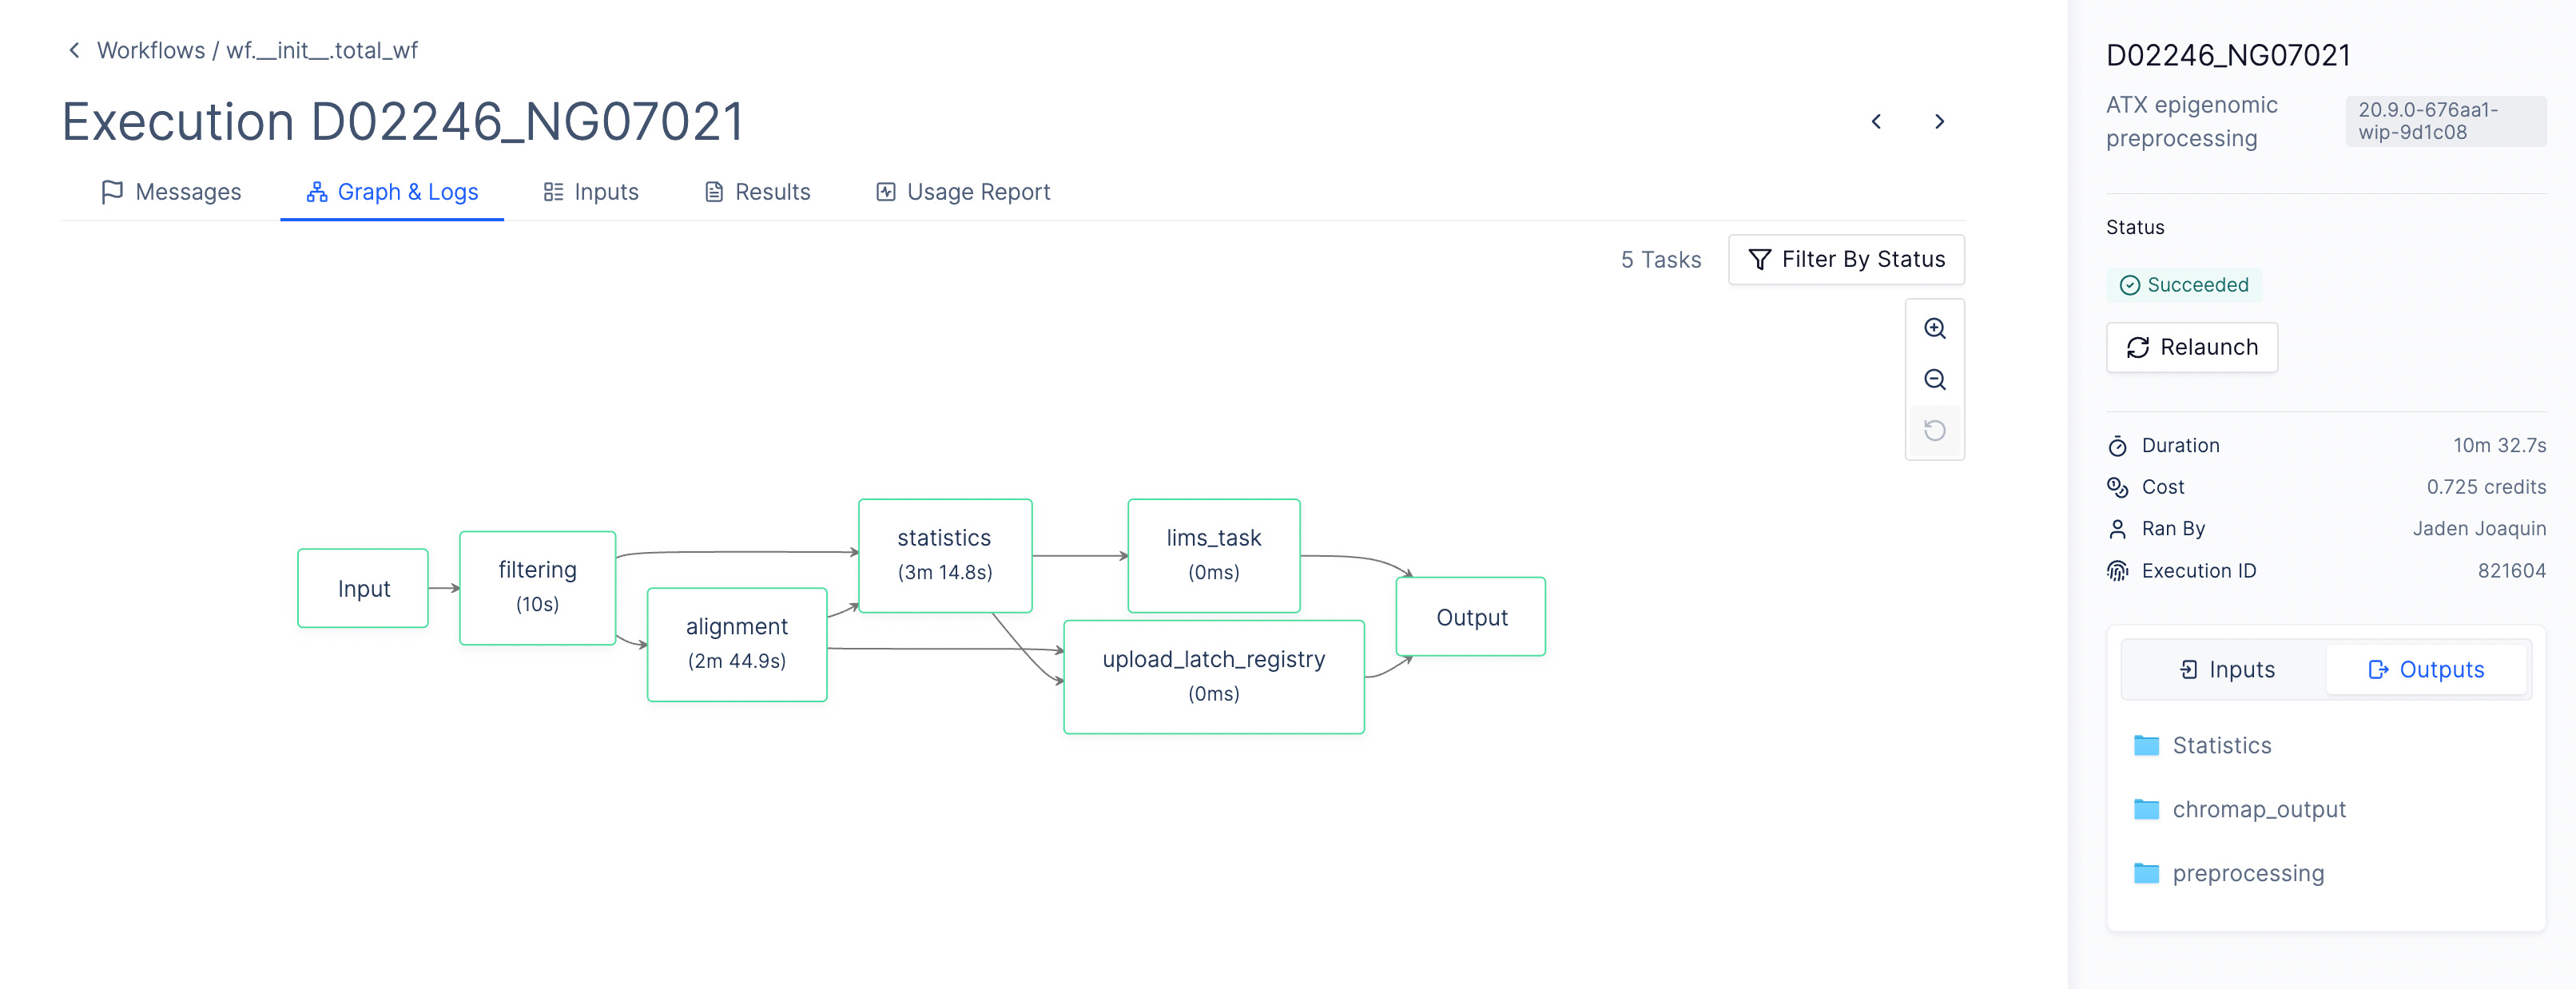
To do this, AtlasXOmics engineers developed a chromap pipeline using the Latch Python SDK, which defines the system requirements, dependencies, and compute resources, as well as a graphical interface enabling scientists to process this data directly without bottlenecking their cadence of experimental work. The pipeline can be run in batch mode to generate fragment files for multiple samples in parallel.
Peak Calling and Differential Peak Analysis
A second AtlasXomics workflow processes fragment files and sample metadata to perform MACS2-based peak calling, peak-to-gene annotation, motif enrichment analysis, and differential accessibility quantification across experimental groups.
The workflow generates three specialized H5AD files for downstream analysis. The cell-by-gene matrix aggregates chromatin accessibility signals at the gene level. The cell-by-motif matrix captures transcription factor activity deviations across spatial regions. The pseudobulked matrix summarizes group-level accessibility patterns, supporting differential analysis for region-specific regulatory signatures.
Visualizing H5AD files with the H5 viewers
These files can be opened directly in a Latch Plots notebook and visualized using the H5 viewer. If an aligned H&E image is available, it can be overlaid onto the spatial coordinates in the H5AD file to contextualize chromatin accessibility or motif deviations within tissue morphology.
In the same Plot notebook, AtlasXOmics engineers developed analysis modules for comprehensive spatial epigenomics interrogation.
Gene Accessibility Analysis
The gene accessibility viewer shows spatial scatter plots of gene accessibility across tissue. The heatmap clusters cells and genes by accessibility profiles. Volcano plots identify differentially accessible genes across groups, while the ranked score plots order genes by effect size or significance.
Motif Activity Mapping
The motif scatter displays spatial maps of motif accessibility deviations. The heatmap summarizes deviation scores across clusters. Volcano plots highlight condition-specific motifs, and ranked score plots prioritize motifs by regulatory impact.
Neighborhood Enrichment
Another tab performs spatial enrichment of gene or motif signals within selected regions, enabling comparison of localized regulatory states.
Genome Browser Integration
AtlasXOmics team added an genome-browser widget in Latch Plots to display fragment alignments and peaks. This can be used to compare peaks and chromatin accessibility across samples or conditions.
Exciting future directions include the ability to enable lasso selection of tissue regions on H&E images, automated generation of bigWig files via Plots cells, and direct ingestion into the IGV viewer for comparative peak analysis between spatial regions.
Together, the H5 viewer and its supporting modules enable fast, interactive interrogation of spatial epigenomic data, linking molecular state, tissue morphology, and regulatory activity in one interface.
Singular: Multi-omic Analysis (Proteome, Transcriptome, H&E) with G4X
The Singular’s G4X™ Spatial Sequencer includes a gene panel derived from single-cell transcriptomic sequences and an accompanying protein panel. In addition, it offers H&E imaging. G4X pushes the boundary by bringing spatial, FFPE-compatible, multi-omic sequencing onto the same benchtop box that already performs bulk NGS, closing several of the biggest gaps left by traditional CITE-seq while trading off maximum protein depth for spatial context.
Viewing Multiple Modalities in One Viewer
With this technology uniting multiple biological modalities, we developed a downstream analysis dashboard marrying information from all data sources in one place.
The H5 image viewer enables scientists and pathologists to examine transcriptomic and imaging data simultaneously, facilitating the easy overlay of transcriptomic and proteomic data on H&E images.
Joint RNA and Protein Clustering
After normalizing and transforming the transcript counts and protein intensity values, we learned a joint clustering from the transcript-count and protein-intensity data. We observed that cluster quality improved when both data modalities were incorporated.
Identification of differentially expressed genes
We then identified cluster 2 and found that the IGHG1 transcript was differentially expressed in this cluster versus the others. Moreover, we saw a co-expression of cytoplasmic antibodies in the cells differentially expressing IGHG1, a canonical signal for plasmablasts and mature plasma cells.
Because the H5 viewer is implemented as a widget, users can instantiate it multiple times within a notebook, enabling side-by-side comparisons of different tissues, conditions, or time points.
To Conclude
The increasing size and complexity of spatial data has created one of the most challenging human computer interaction problems in the history of computing. Our H5 viewer tackles challenging problems in data intensive engineering, consolidates fragmented spatial machine outputs into standard inputs and brings together a rich ecosystem of open source tertiary analysis tools. Our team is excited to continue to improve these tools as spatial continues to progress and expand support for new technologies.
LatchBio works directly with many of the spatial vendors described here, like Curio and AtlasXOmics, providing white labeled infrastructure and analysis tools that help their customers close the loop on analysis and sell more kits. If you are a spatial solution provider interested in providing these tools to your customers, reach out.